Searching for healthier revenue — the process behind Clearbit's new ideal customer profile

They say all publicity is good publicity. But is all revenue good revenue?
In early 2020, we started an investigation into our ideal customer profile (ICP) that deeply changed the way we think about the value Clearbit brings to customers and who our best customers actually are.
We had historically considered top-line growth to be our #1 company metric. “Growth solves all problems” and whatnot. But when we looked at our revenue in terms of renewal, expansion, and lifetime value — after the close — we saw a truly surprising picture.
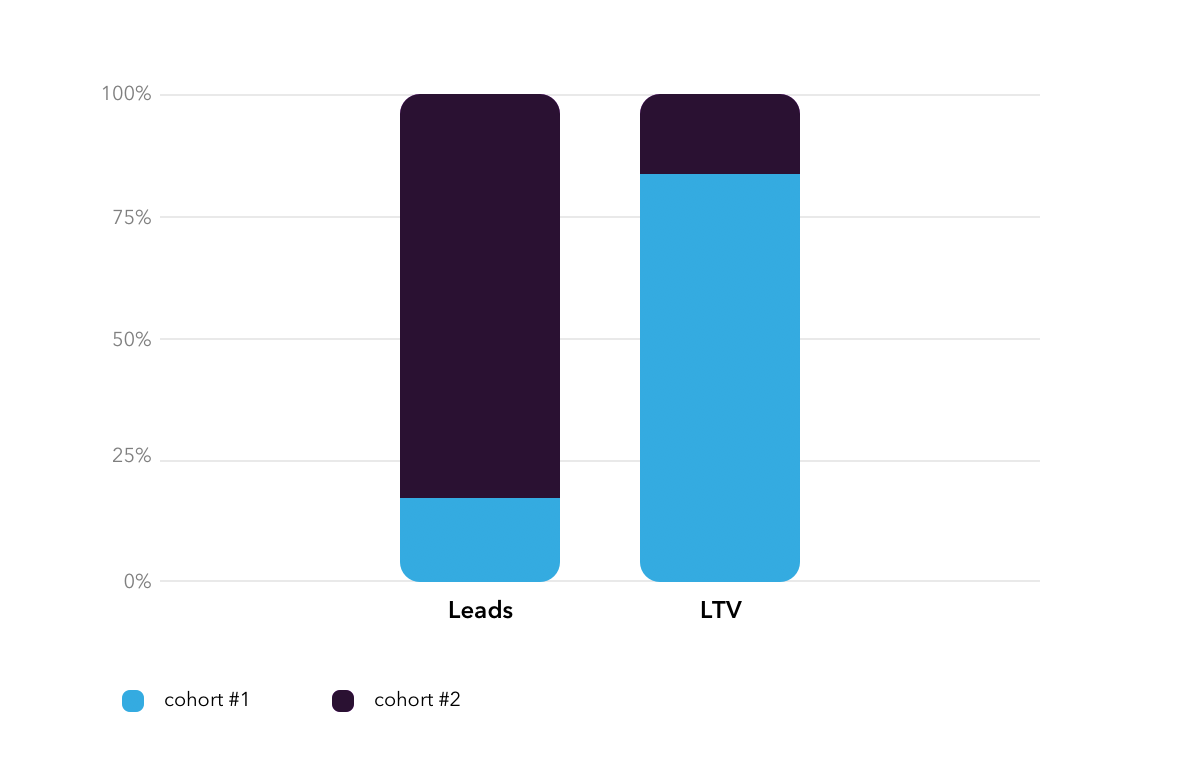
We found that the Pareto principle holds true for us: around 86% of Clearbit’s long-term revenue comes from around 18% of the leads that enter our funnel.
Leads in this 18% group turn into healthy customers that get outsized value from Clearbit: they renew annual subscriptions and increase their spending with us over the years. When we zoom in on this segment, we have the makings of a remarkably efficient SaaS company. In fact, our metrics for this business match or exceed the industry-leading B2B SaaS unicorns.
This realization has refocused the entire company across marketing, product, sales, and post-sales — and it all started with redefining our ICP. ICPs are often designed to drive top-line revenue growth or bookings, as ours was for the first five years of Clearbit. However, our new ICP ignores first-time bookings in favor of focusing entirely on customer lifetime value (LTV) — an LTV ICP, if you will.
Here is the story of how we found our LTV ICP and used it to orient all of Clearbit’s efforts around one customer, one goal.
Jump to:
- Redefining our ideal: top-line revenue versus healthy revenue
- The search for a healthier ideal customer profile
- Two segments: A simple guide for the whole company
Redefining our ideal: top-line revenue versus healthy revenue
Let’s start by painting a picture of where Clearbit was as a company late last year.
At a little over five years old, and like many of our peers, we measured our performance by quarterly net-new ARR. This focus on top-line revenue growth wasn’t uncommon in an age of cheap capital and booming markets.
Of course, Clearbit also invested in customer success teams and retention programs to grow accounts after they close. But at a high level, top-line growth was still our ultimate metric. It was how we reported our success to investors and benchmarked against our competitors. It was also how we incentivized our sales teams, and it provided the data around which we built our company models, like our ICP.
 funnel ending with a sale
So, we might ask again: is all revenue good revenue? Why not just sell to anyone, while also investing more into healthy customers? Dollars are dollars, right?
The issue is when there are customers who don’t get enough value from Clearbit, we spend a lot of time and resources up front to close them while they are significantly less likely to be successful with us over the years.
We simply hadn't been discerning enough about whether Clearbit could provide long-term value.
Our previous ICP: Focused on top-line growth
Our original ICP drew from a list of all our closed customers and finding their shared characteristics, such as:
- Number of employees (a.k.a. company size)
- Type (B2B SaaS companies)
- Country (the USA)
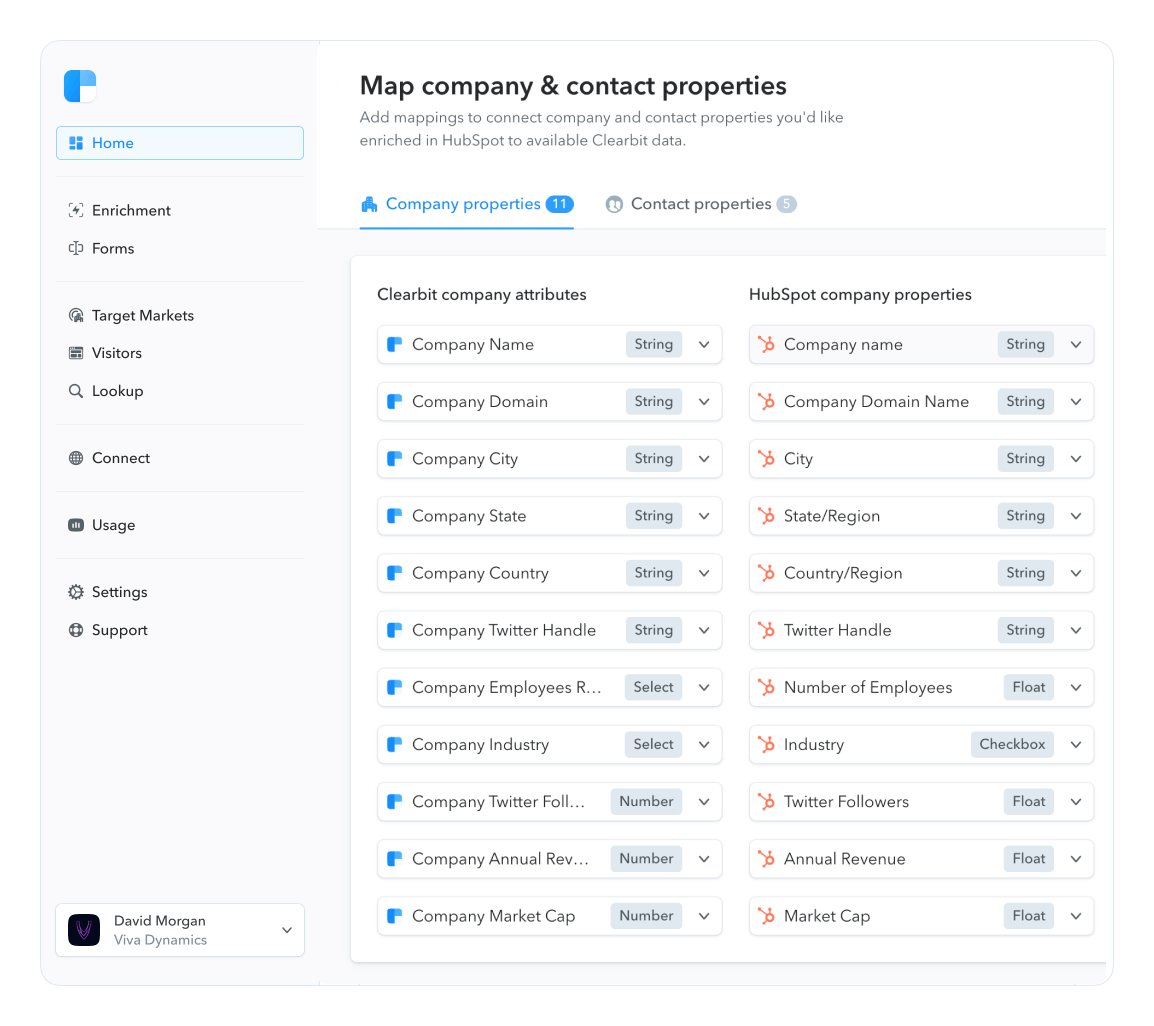
- Using a certain set of martech and BI technologies (such as Marketo, HubSpot, or Google Analytics)
The lists that resulted essentially just mirrored our closed/won opportunities. It’s also important to note that this ICP was also an “inbound ICP.” Until recently, Clearbit has been 100% inbound driven. We sold to folks who knocked on the door, rather than taking a step back and thinking about who we wanted to go after.
This old ICP was still helpful. It allowed us to automate many aspects of our sales process and marketing, such as routing the highest-value inbound leads straight to the sales team. It also guided us in prospecting, identifying target accounts, and narrowing our ad spend.
But through the research we did this year, we were able to narrow down our ICP to one that maximizes long-term value rather than just first-time value.
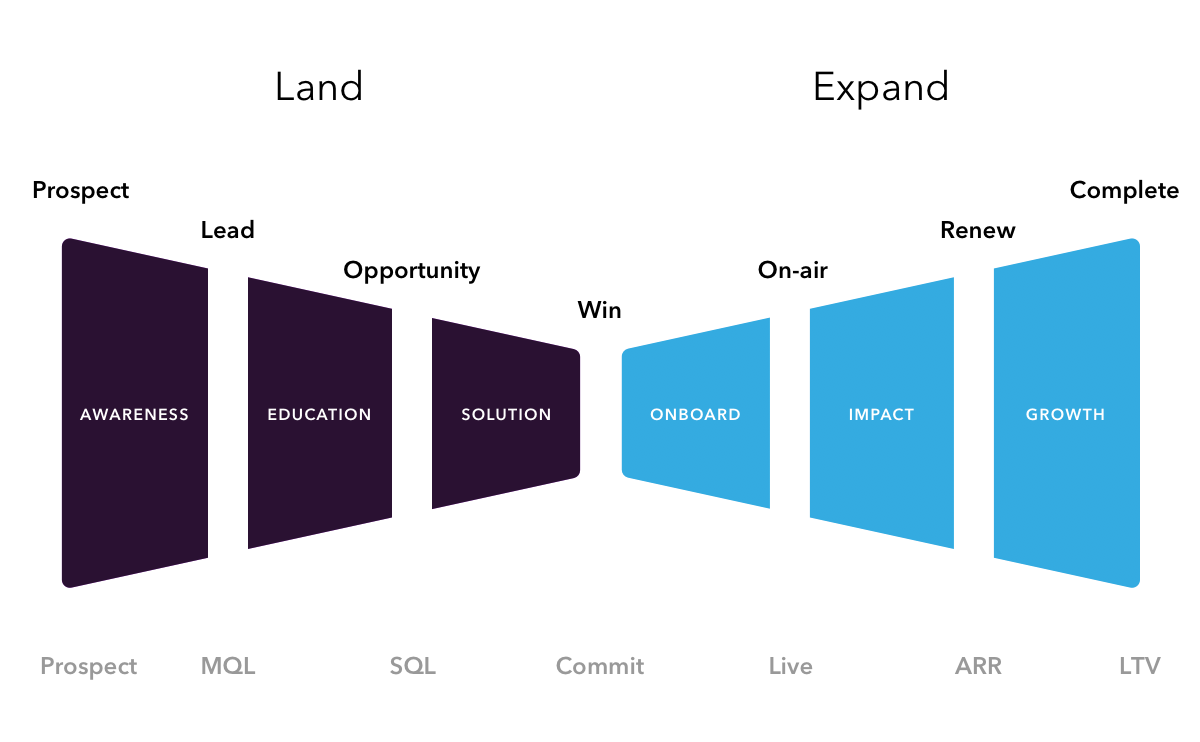 Considering a different kind of funnel: the bow tie model for growth
The search for a healthier ICP
This line of inquiry started with some observations and a strong hypothesis.
Some of our more experienced Clearbit folk, particularly on the Customer Success team, were skeptical about whether a few of the newly won customers would be successful with Clearbit.
We asked them why and started inquiring about which customers were very successful. They told us that, anecdotally, the customers who seemed to do well with Clearbit were those who had high lead volume and website traffic.
We quickly checked the hypothesis by analyzing the LTV of all our customers, current and churned. We compared low-traffic companies with high-traffic ones, using Alexa Rank as a proxy for traffic (Alexa Rank is a Clearbit Enrichment attribute).
The high-traffic customers had a 20%–30% higher LTV than the others. This made us perk up our ears.
We needed to compare cohorts of companies that contained leads and customers, so we could think about prospects in terms of potential LTV. Here’s how we did it.
When should I do an LTV ICP analysis?
By the time we started in January 2020, we were equipped with data that would make the investigation easier. We had enough customers to make meaningful cohorts, as well as renewal data after we'd started offering annual subscriptions in 2017.
If your SaaS company wants to do the same analysis, a good benchmark might be to have ~$10M ARR and two to three years of renewal data. (But don't let a lack of data stop you from taking a deeper look into the true impact of your products!)
Expected lifetime value per lead: One comparison metric to rule them all
The comparison metric that enables us to compare the future value of a cohort of leads is expected lifetime value (ELTV) and its derivative, expected lifetime value per lead (ELTVL).
Here’s how it works. We take LTV data from the customers in a cohort and pull it all the way back to the “beginning,” figuring out just how valuable all the leads in that group were as a whole.
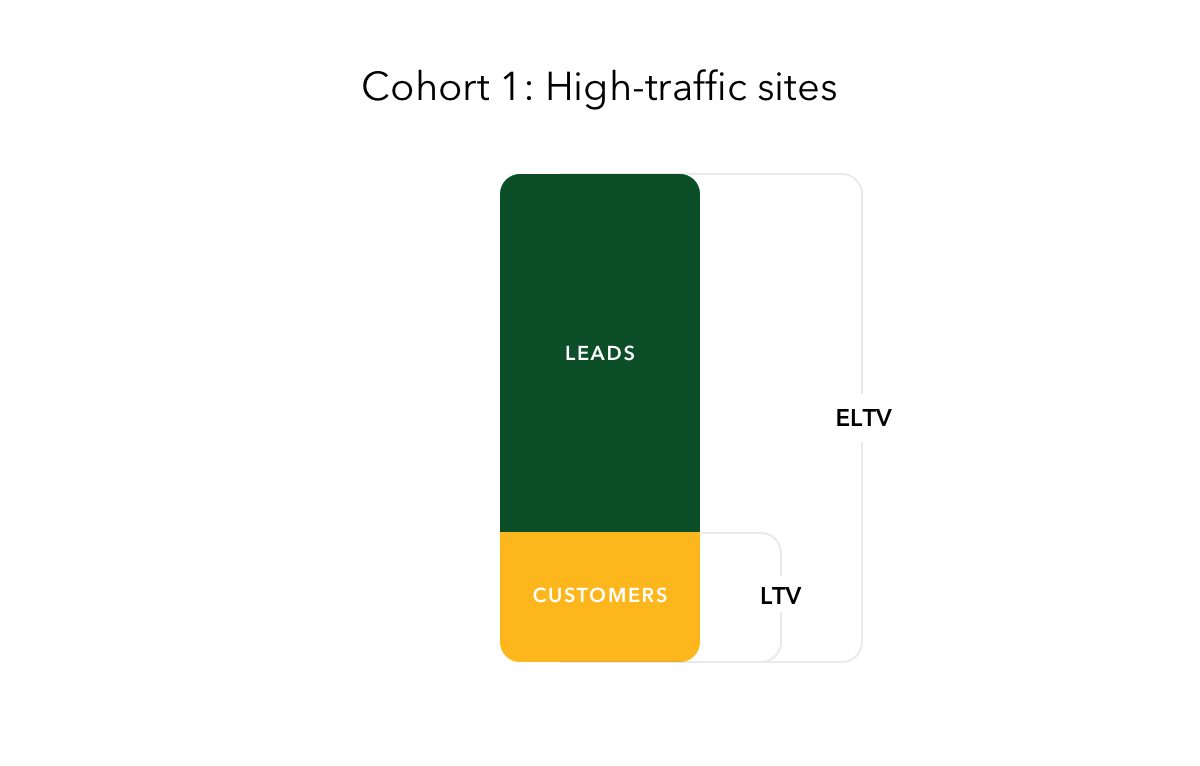
We can then divide ELTV by the total number of leads to determine ELTVL. This lets us assign an expected value to new leads in our funnel that fit in the cohort (those with similar characteristics).
We like ELTVL because it gives us one metric to use when comparing groups, rather than using many in-between conversion points, such as “lead to MQL,” “MQL to SQL,” “SQL to SAL,” “one renewal,” “two renewals,” and so on. It abstracts the calculation to give new leads a dollar value.
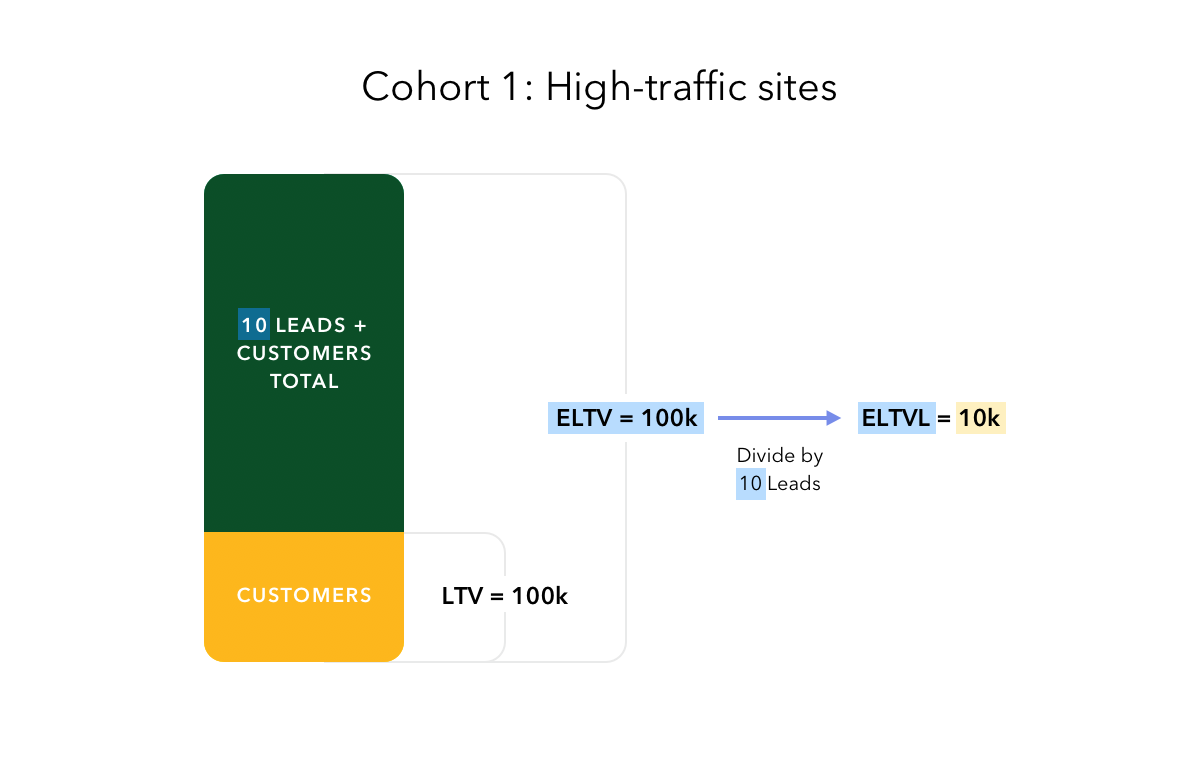
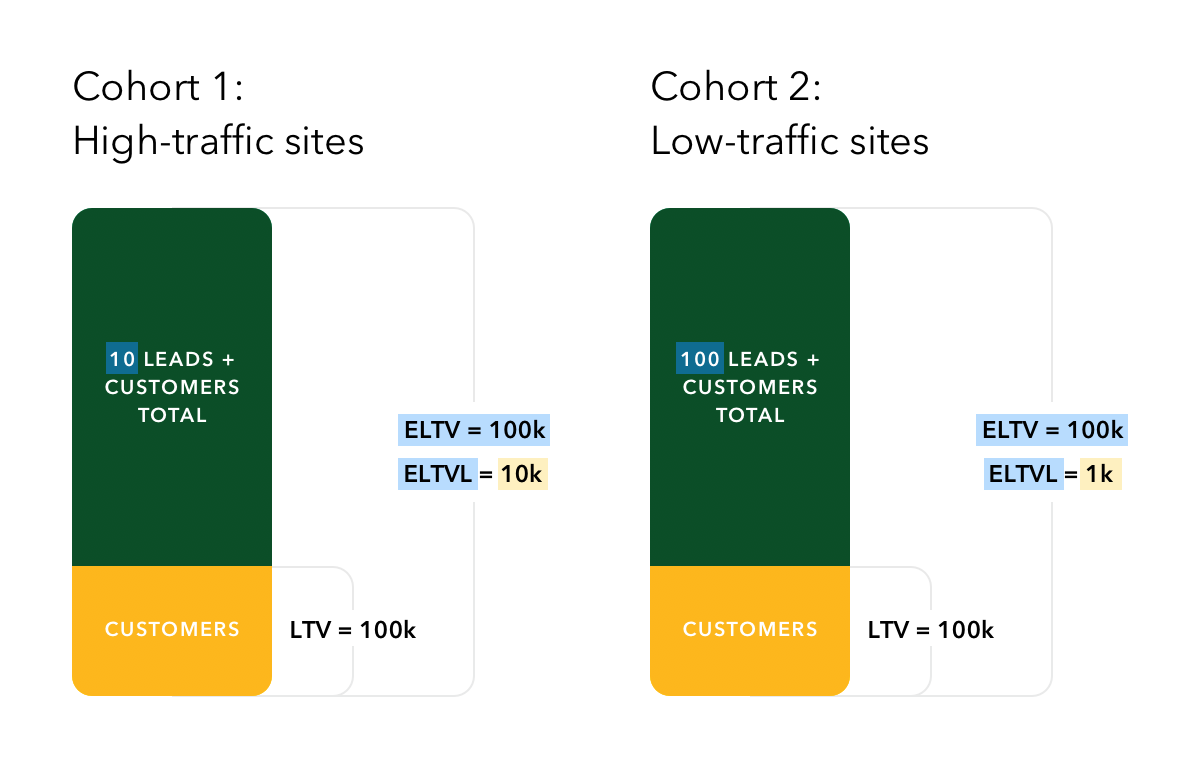
If there are 100 leads in a cohort, and we sell one at $100k, then the ELTV of the cohort is $100k and the ELTVL is $1000 (dividing $100,000 by 100 leads).
But if the group is a bit more “selective” and has 10 leads, and it produces $100,000 of LTV, then the ELTVL is $10,000. The leads in this smaller cohort look quite a bit more valuable than the larger one.
This method of comparison lets us draw lines around different segments of customers, based on various defining characteristics, until we get a group that produces a high ELTVL.
Let’s take a look at what happened when we used website traffic to draw those lines. (We also tested other variables, such as company size, industry, and technologies used.)
Hypothesis testing with ELTVL and our new LTV ICP
We already knew that the higher the website traffic, the higher a lead’s ELTVL. But if we wanted to segment our entire prospect and customer base using website traffic, how many segments should we create? And where should we draw those lines?
Our goal when creating these groups was to find the smallest size cohort for the maximum ELTV. For simplicity’s sake, we wanted as few groups as possible, but as many as were necessary.
We began to move the lines between segments until the ELTV looked sufficiently different. We didn’t want the difference between ELTV to be, for example, $100, $200, $300, $400; we wanted it to look more like $100 versus $5000.
This is what we found when we segmented our user base into four groups:
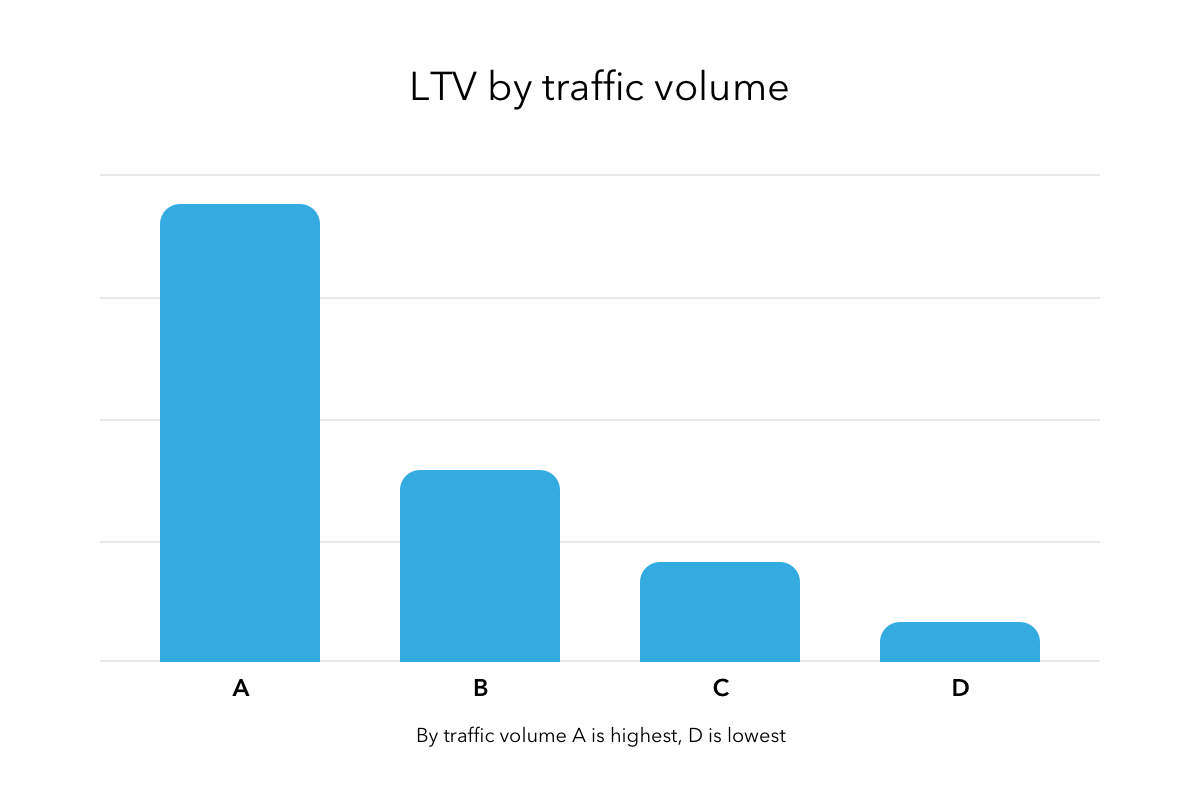
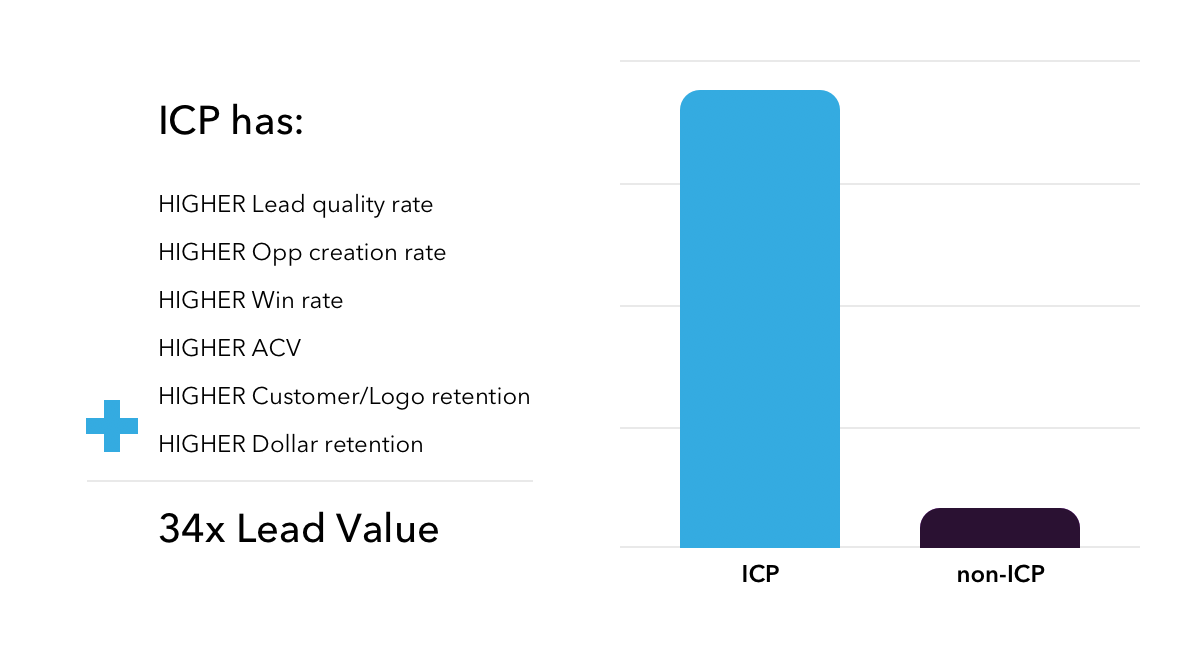
Then we simplified it a little more. We found a model where we needed only two groups. Using just one Alexa rank number, we discovered that everything to one side, the high-site-traffic side, had an extremely high ELTVL.
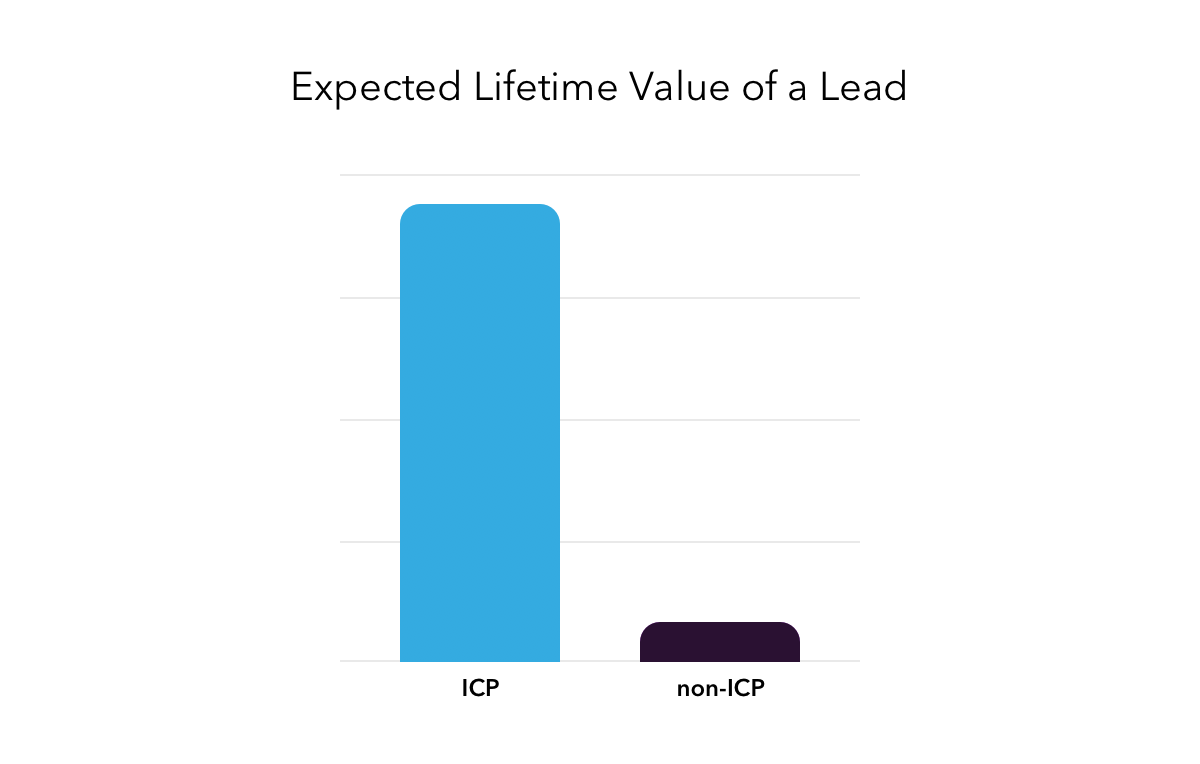
A lead in this cohort had an ELTVL 34 times higher than leads in the other group that had lower site traffic. 34 times!
After testing for interference from other variables (more below), this healthy-customer group with very high website traffic eventually became our new ICP.
We’d always had a hunch that website traffic mattered, but we had never investigated it deeply in the context of LTV. And we’d never seen it backed up so broadly and powerfully until now.
Why does website traffic matter so much? Well, when you think about it, website traffic is a proxy for lead volume.
The more site visitors a company has, the bigger their database of leads and the more value they’re likely to get from Clearbit as they work to understand, segment, and prioritize those leads. They deal with a lot of noise and Clearbit helps them find their signal.
So, in a way, it’s not really about high web traffic; that’s just an indicator. We had to check whether website traffic really was the strongest variable to predict lead volume and ELTVL . . . or if it was influenced by another, stronger variable.
We did a light covariance analysis, testing the effect of other firmographic attributes on ELTVL, such as:
- Number of employees
- B2B companies vs B2C companies
- Revenue
- Marketing team size
- Industry
Some of these variables did create a nice segmentation, and in particular, the number of employees was a strong predictor of ELTV. But when we normalized for website traffic, it barely made a difference.
Website traffic was by far the strongest predictor, and now we had our ICP: any company that had higher website traffic than a certain global Alexa rank number.
This neatly divided Clearbit’s addressable universe into two: ICP or non-ICP.
Funnel analysis: The Pareto principle in action
We now understood who our most valuable customers were, defined by a single Clearbit attribute: website traffic as a proxy for lead volume.
Next, we wanted to understand how our ICP and non-ICP customers behaved and converted in each step of Clearbit’s funnel (or bow tie, as it were).
The funnel stats we looked at included:
- # of Leads
- # of MQLs (marketing-qualified leads)
- # SQLs (sales-qualified leads)
- # SAOs (sales-accepted opportunities)
- # Won (customers)
- $ Bookings (revenue at the time of booking)
- $ LTV (lifetime revenue)
We found that 18% of our total leads were ICPs, and they were responsible for over 86% of our long-term revenue.
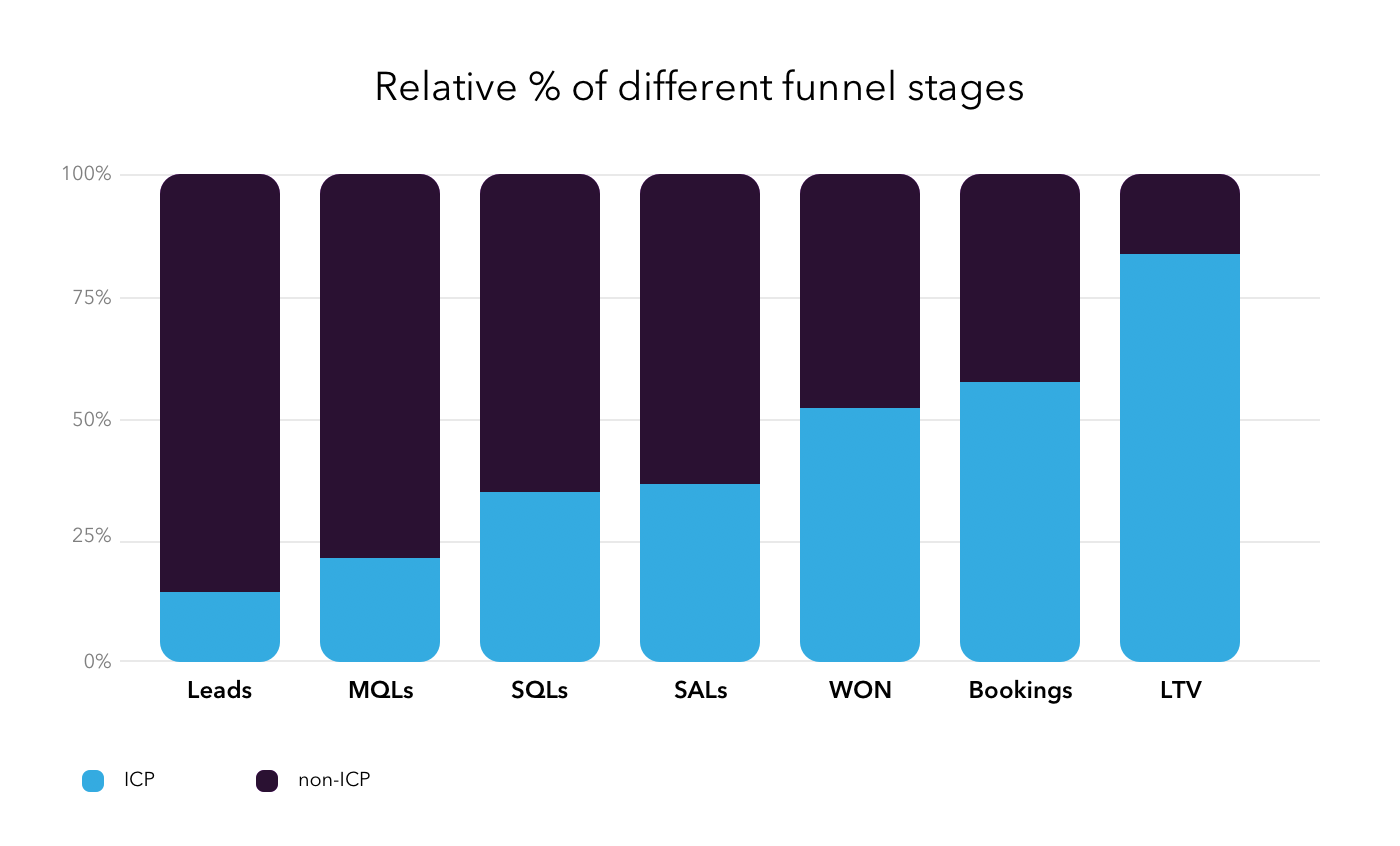 About 18% of our leads end up driving 86% of our LTV: the Pareto principle at work.
This 18% of leads drove a little over 50% of bookings; that is, they made up half of our “won” customers and half of the “revenue at the time of booking.” But they renewed and expanded more.
They were also easier to sell and convert at every stage of the funnel. The chart above shows this in action when the lower bar (ICP prospects) increases in size relative to the upper bar (non-ICP prospects). And slightly higher booking revenue compared to number of won customers means that ICPs had slightly higher average contract value.
These customers were more efficient by many metrics, including lead quality rate, opportunity creation rate, win rate, ACV, logo retention, and dollar retention.
We had found what we were after: the fewest cohorts possible (two) and a small yet meaningful cohort size that produced outsized ELTVL. Our ICP was looking rosy.
Two segments: A simple guide for the whole company
Is it really a good idea to have only two customer segments, based on one variable? It sounds overly simplistic.
And how do we know that we drew the “line” at the right Alexa rank? What about tiered lead scoring and customer personas? After all, the real world is nuanced. And Clearbit has detailed datasets on prospects, which help make sense of those nuances, so surely we were equipped to have a more complex ICP.
Well, there is a lot of value in simplicity.
It’s easy for everyone in the company to rally around the concept that website traffic correlates with long-term customer success. We benefit from having a simple, directionally correct answer when we ask, “Who are our healthiest customers?”
The knowledge that one segment is 34 times more valuable than the other is extremely helpful, even if we drew the line a little “off” and that segment is only, say, 25 times more valuable. Our work would be much more complicated if we had a web of five equally important metrics, all interacting with one another.
With our new model, we’re confident that every lead going to an SDR, AE — and eventually a CSM — is more valuable than before. Period.
And, of course, we are also treating this as a starting point to improve on. Our team has been busy digging deeper and trying to understand the subgroups inside and outside of our new ICP, and finding ways to properly serve non-ICP customers.
But for now, let’s take a look at some of the changes, both easy and difficult, that we’re making across the company in light of our new ICP discovery.
How teams are changing to serve our LTV ICP
It’s true that simplicity is very helpful, but in some ways, this was not an easy mental change. Clearbit can no longer rely on the playbooks we previously used to drive top-line growth. We’re playing a different game now.
Let’s look at it from our sales team’s perspective. They had been working from our previous ICP model and focusing their energies on a subset of Clearbit site visitors.
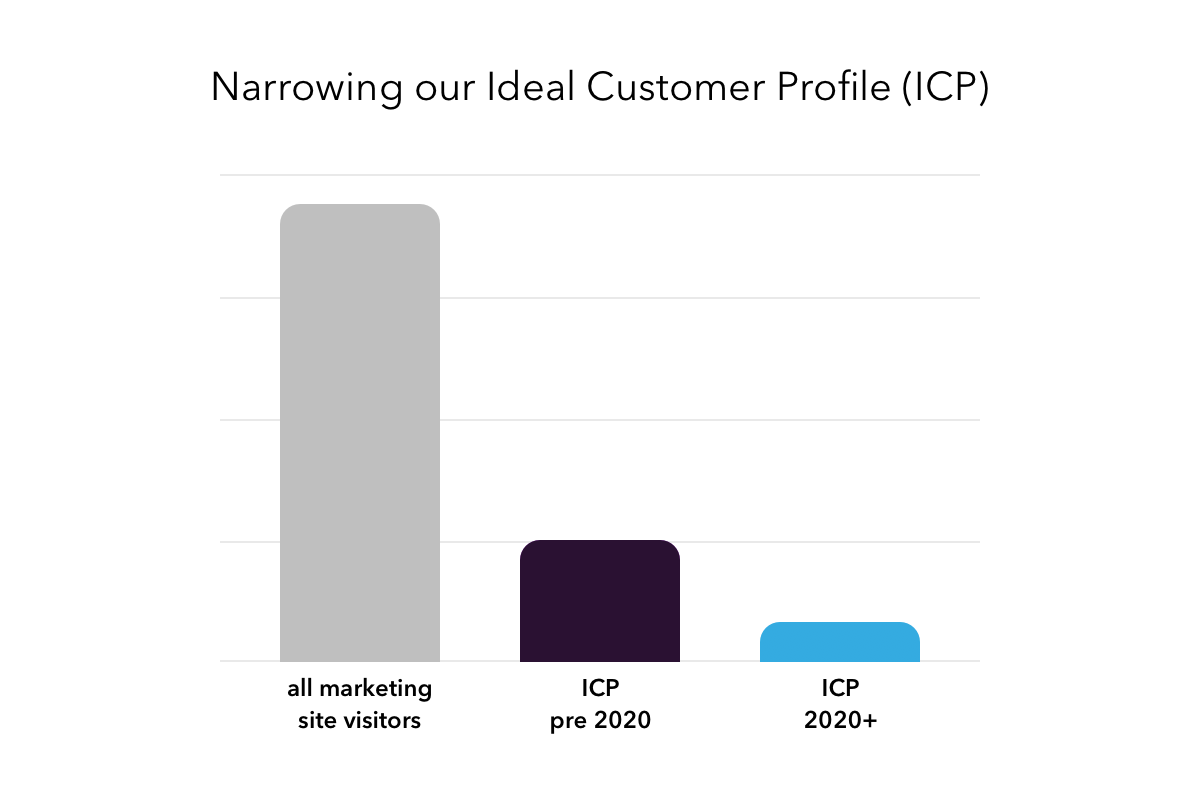
With our new ICP, that addressable group was slashed. Imagine how you’d feel if you were in sales and could now only speak to a third of the leads you were used to having.
This caused some fear, uncertainty, and doubt in our sales and CS teams. It’s a tough culture change and it doesn’t positively affect their paycheck right away. We needed them to understand why a narrow focus was right for the business and would keep the company healthier in the long run.
Some decisions began to get easier, though, thanks to our new model’s simplicity. Shifts across Clearbit teams include:
- Product: Making changes to Clearbit’s product roadmap and thinking more carefully about features and functionality that affect high-site-traffic customers.
- Engineering: Making sure the product scales for high-volume customers.
- CS: Finding new ways to provide white-glove support for our ICP customers and help them solve their pain points.
- Marketing: Changing our site conversion flow to route ICP leads to the sales team, adapting our lead generation tactics to a new target audience, and thinking about how we can serve the other 82% of leads well with self-serve flows and more scalable support and content. Budget expectations were also renewed: if the new value per lead for ICPs is much higher than before, it opens the door to more fun and interesting marketing activities.
- Sales: Creating incentive structures within contracts to improve customer success over the long term and offset the risk of churn. In addition, SDRs are speaking with potential customers who aren’t a great fit for Clearbit and helping them understand why through the buying process. That’s not something your average SDR does.
Leadership plays an important role in reinforcing the benefits of Clearbit’s new, narrowed focus. Again, the fact that it’s such a simple binary — difficult to misinterpret and bend the rules — makes it easier to repeat over and over. Simplify. Repeat. Repeat.
And, of course, it opens a new set of questions. Is this going to work? Will all our teams’ efforts make a real impact on Clearbit’s long-term profitability? Are we truly having higher-quality sales conversations?
Perhaps the most important question is this: If we narrow the top of our tunnel, are we willing to take a short-term hit to top-line revenue growth in exchange for long-term profitability?
Growth-stage startups constantly grapple with this tension, especially when growth is so incentivized by VCs and the SaaS industry at large. Consequently, they may put aside decisions that threaten top-line growth, even if they know it’s healthier in the long run.
We need to remember that growth is not the only thing that matters. Healthy customers — for healthy revenue — are crucial, especially when the economy changes. Sometimes, a worldwide event like COVID gives us the push we need to re-examine ourselves and find the phenomenally efficient company within.
 Learn how to define your Ideal Customer Profile and activate your ICP throughout the funnel in our latest book with HubSpot, How to Scale Your Business with Your Ideal Customer in Mind