Chapter 5
4 minutes
Put your data to work
The View-Master was first introduced at the New York World’s Fair in 1939. While it was originally intended to be an educational device, it soon became a children’s toy, with slides that told stories of Bugs Bunny, Wile E Coyote, and more.
B2B marketing attribution and reporting have a lot in common with the View-Master. With the right attribution infrastructure in place, data can be presented in different ways for different teams, and a click of a button can reveal an entirely new perspective.
If you take one thing from this book, it’s this: attribution is not about having the perfect model or tech, it’s about giving sales teams and marketing teams the right information to make strategic business decisions throughout the customer journey. As Julie Beynon, Head of Analytics at Clearbit, says, “reporting is the reason we do attribution.”
Data visualization
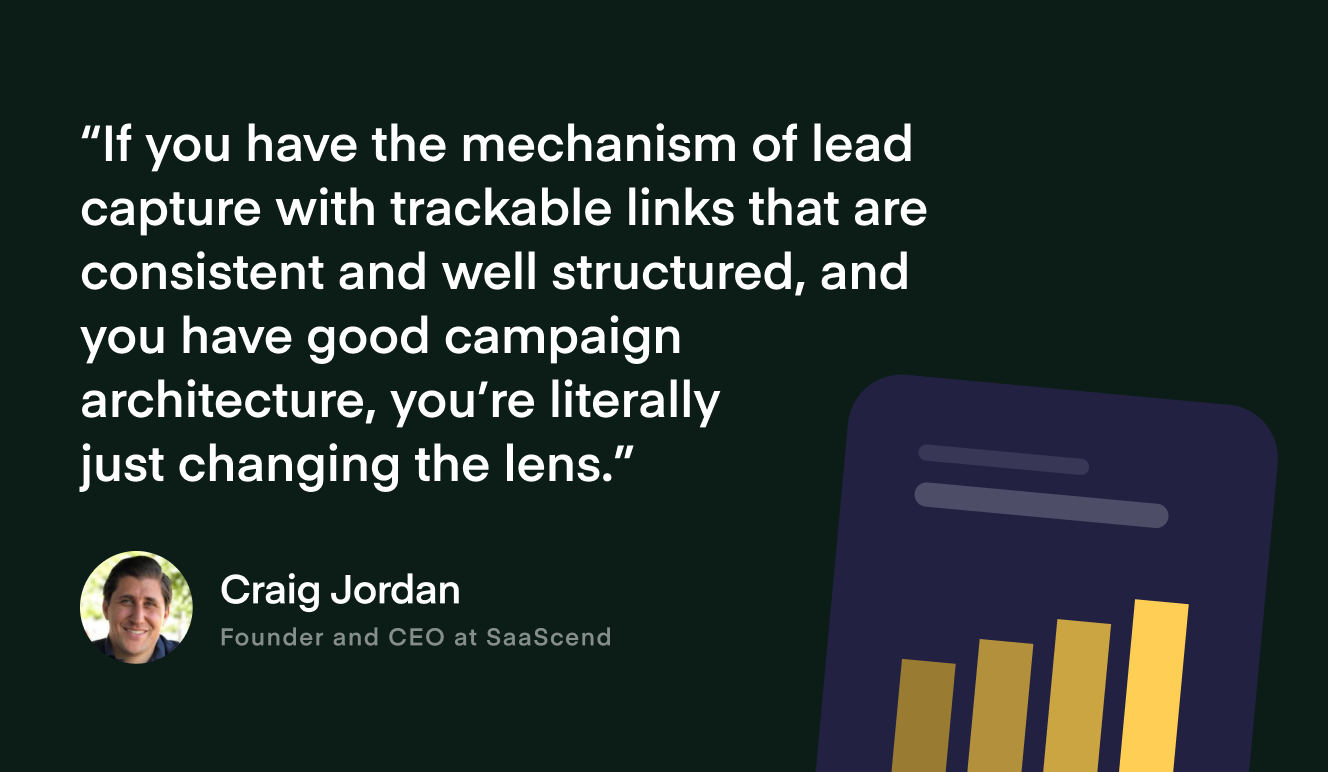
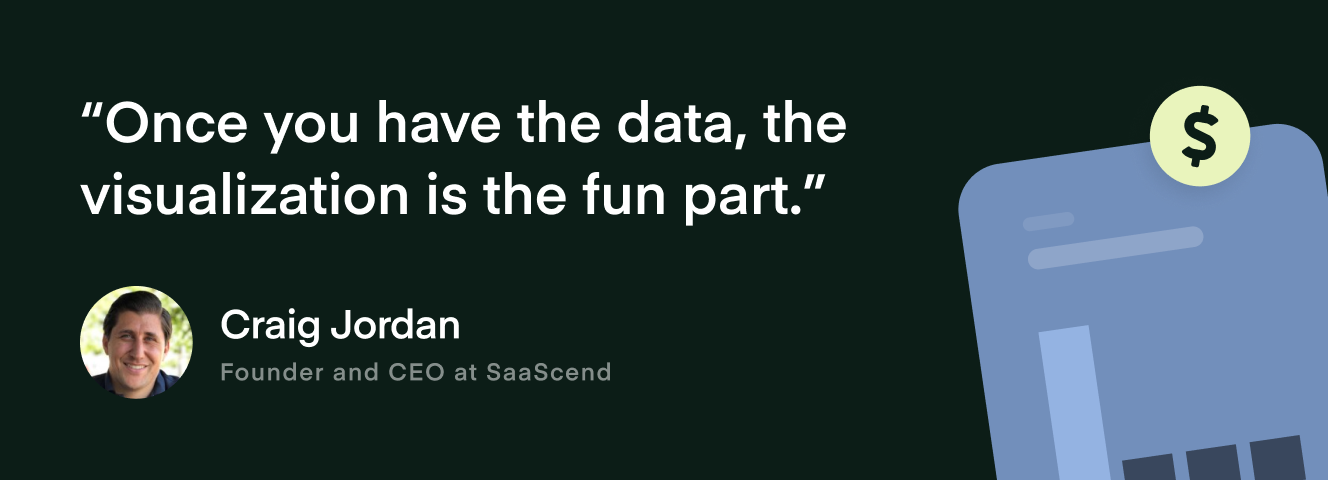
Reports and dashboards can be built with native Salesforce reporting, business intelligence tools like Mode, or custom reporting tools. Much like choosing an attribution model, there isn’t a one-size-fits-all approach. Craig Jordan, CEO and Founder at SaaScend, shares, “Once you have the architecture in place, how you showcase it is up to you.” As long as you can surface the information that is critical to your business, you are on the right track. Robust reporting enables teams to make smart decisions about their marketing strategy and where to allocate budget.
Here’s how SaaScend and Clearbit visualize their attribution data.
SaaScend
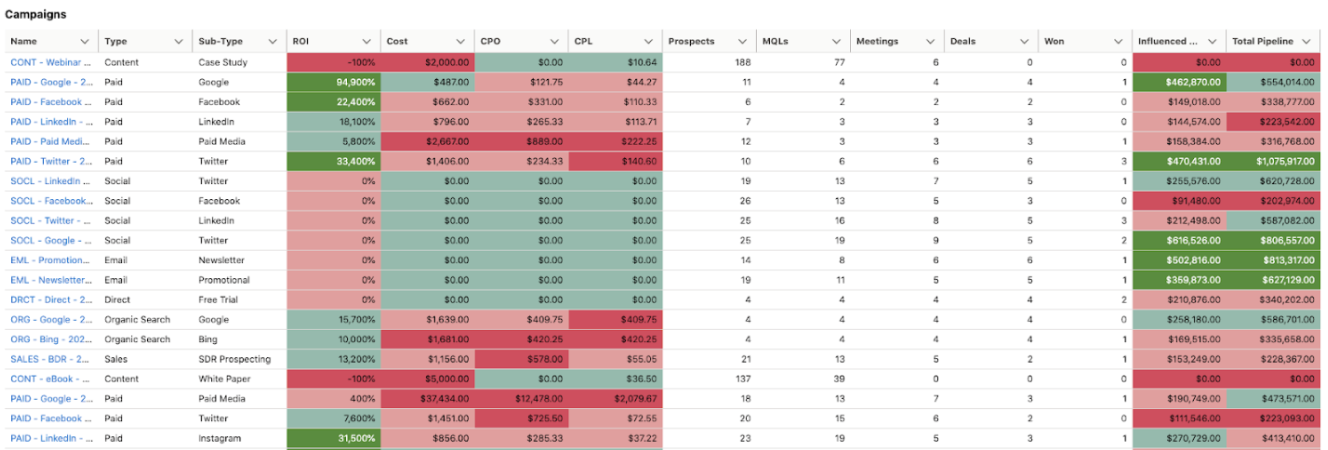
Craig uses native Salesforce table functionality overlaid with conditional formatting to showcase his attribution information. At a glance, he can read this report in his CRM and understand which campaigns are succeeding based on different criteria like ROI or pipeline. Having this level of granularity enables Craig and his team to dive a level deeper and look at performance by channels, content, and more. The SaaScend team can quickly identify what is working and what isn’t to adjust their spend and get the most out of their budget. Regardless of how you choose to build your reports, Craig advises marketers to “look at the key metrics that matter and focus on lagging indicators rather than leading indicators.”
Clearbit
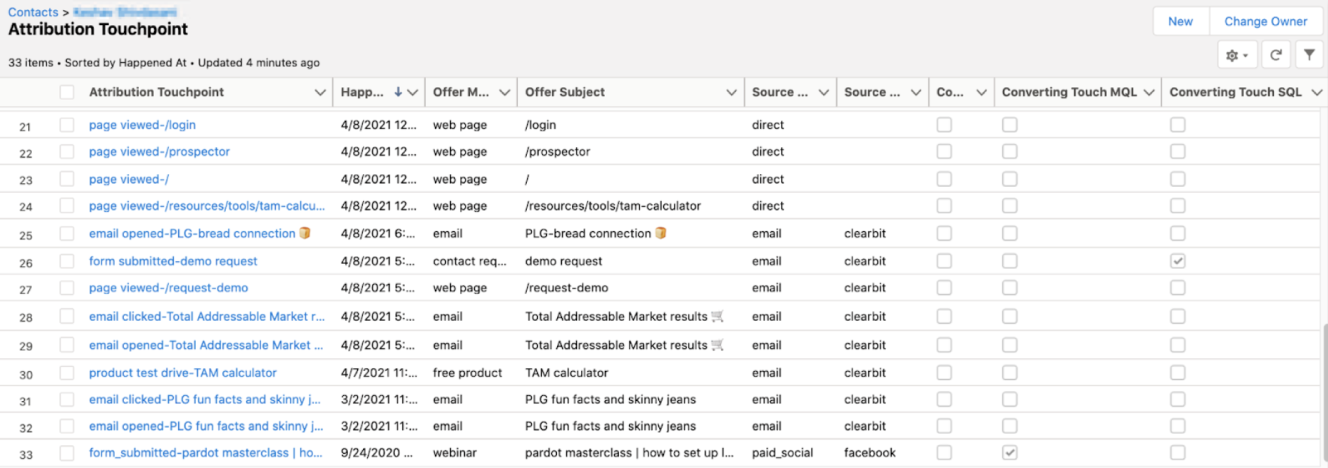
Julie built a beautiful report in Salesforce to bring together all of our attribution data. The report displays a detailed list of marketing channels and touchpoints as the converting touchpoints for lead, MQL, and SQL. We will talk about some of the ways the team uses this data in the section below.
Reporting for different stakeholders
Data needs to be presented differently for different audiences and available in a tool that your teams know how to use.
For example, a CMO and a marketing analyst are going to want to view the information in very different ways. Craig suggests looking at attribution reporting in three tiers: executive-level reporting, management-level reporting, and individual contributor-level reporting. While reporting by function or level is a great start, individuals also need to be able to find the lens that gives them the information they need.
Surfacing attribution data in a tool that marketers use daily, like Salesforce, enables them to self-serve. Rather than spending time learning to code or trying to piece together multiple sources, marketers can easily run reports to support the nuances of their business function. For example, our growth team can easily see what marketing campaigns generated the most leads, MQLs, and SQLs to make decisions about where to invest spend moving forward. Our content team can see what topics are generating leads and SQLs to determine what subjects and formats to pursue next.
Think about how the information will be surfaced to other teams as well. How will sales view this information? Is the information displayed in a tool they are already comfortable using? You want to make sure you provide a granular, but not overwhelming level of information. Speak the language of your audience.
Data in action
With the reporting in place and your teams empowered to uncover insights, it’s time to take action. Here’s how Clearbit’s sales and marketing teams use our data to drive revenue.
Intent scoring: Implementing our attribution model has enabled Julie and the team to build an intent scoring model in dbt. This intent score gives each user a value based on their engagement with Clearbit in the last 30 days. This score provides insights into what percentage of our audience is engaged, how that is changing over time, and what we can do to increase user engagement.
Personalized buyer journeys: Say goodbye to generic and irrelevant campaigns. With easily accessible attribution information, sales and marketers on the team are better equipped to deliver custom outreach messages. For example, our account executives can easily research prospects, see that they have been engaging with personalization content, and share information on how Clearbit Reveal may help in their personalization efforts. Marketing can also use this attribution information to deliver highly-personalized email campaigns.
Account-based marketing (ABM): With attribution in place, we can understand engagement across an account to know what message is resonating, understand account dynamics, and identify areas of opportunity.
Now that we’ve discussed the building blocks of marketing attribution and how to use the data, let’s take a look at how Clearbit and Envoy put it all into practice.