Chapter 6
6 minutes
How Clearbit and Envoy built successful attribution strategies
Hopefully, after reading this book, attribution seems more attainable and less like a form of wizardry. In an attempt to continue to bring clarity to a confusing topic, we are sharing how Clearbit and Envoy put attribution strategies into practice. Looking at these two examples is a reminder there is not a one-size-fits-all approach when it comes to selecting a marketing attribution model, and the only right answer is the one that drives you towards revenue.
Clearbit’s attribution strategy
If you’ve read the other chapters in this book, the name Julie Beynon may ring a bell.
Julie Beynon is the Head of Analytics here at Clearbit and the leader of the attribution charge. When she joined Clearbit in 2018 she was asked by the team, “How are we doing?”. This question led her to audit all of our marketing efforts across the customer journey to ensure we had the right tracking in place, which was foundational to building a robust attribution model.
Attribution model set up
When Julie first started building an attribution model she was set on a fancy multi-touch model, a thing of analyst and marketers' dreams. However, after speaking with key marketing and sales stakeholders she realized the teams were more interested in key milestones and what converted a lead at each stage in the funnel. Having these conversions was extremely important in the process and ultimately led Julie to build a converting touch, last-touch attribution model.
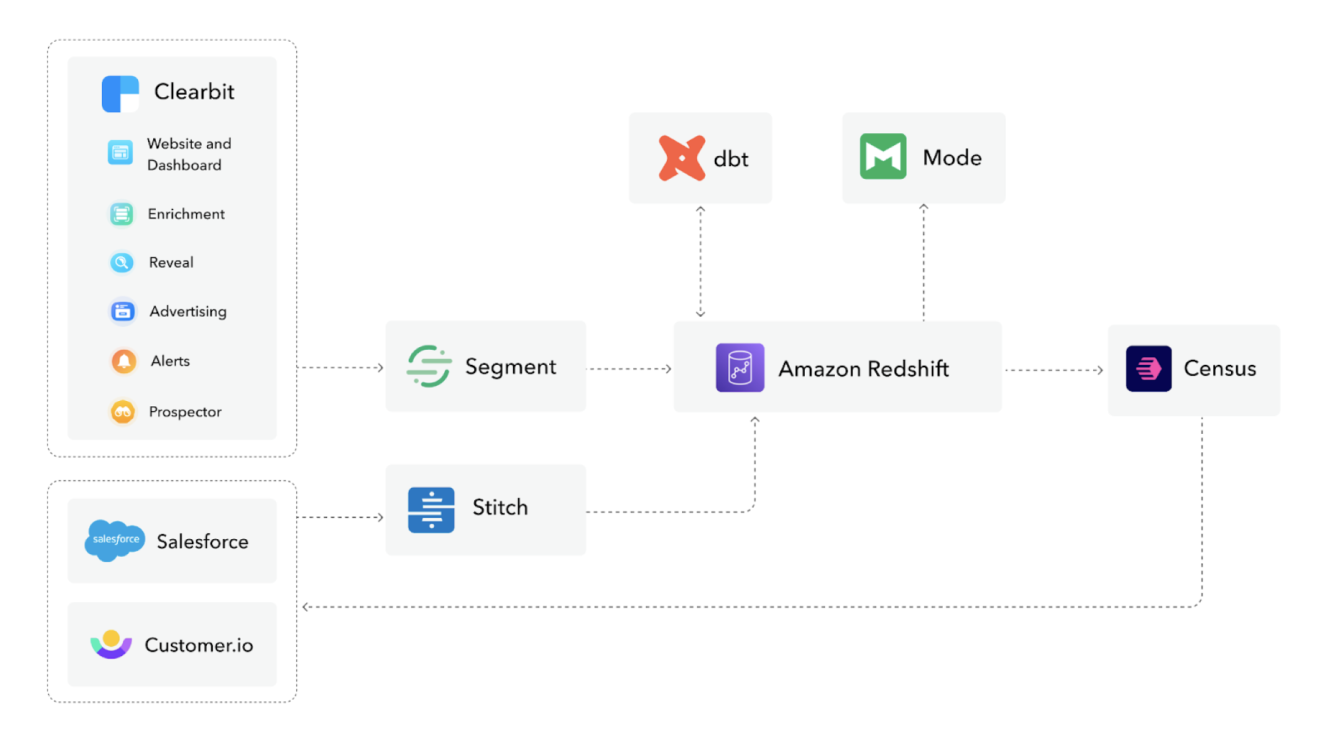
Our attribution model includes data from over 10 different sources like ad and email platforms. Wrangling over 10 different sources was no easy task, but necessary to accurately represent all the behavioral inputs. Synthesizing all of these data points into one model also results in a much more usable data system (one that doesn’t require coding) for the end-user. Julie masterfully stitched together our key data sources with Redshift, our data warehouse, at the center.
She worked with the marketing team to define key behavioral touchpoints like attending a webinar or downloading a piece of content.
Here are examples of behaviors we track:
- Registering for, and attending, a webinar
- Downloading an ebook
- Opening and clicking on emails
- Viewing a paid social ad
- Reading a blog post
- Visiting our website's Pricing page
- Requesting to speak to Clearbit's sales team
- Signing up for a free Clearbit account
- Usage of Clearbit's products as a percentage of their plan or contract's quota
Julie created these behavioral events as SQL files in dbt. As events occur, they are tracked in Segment and then fed into dbt, which ultimately translates the data into our attribution model table.
The output
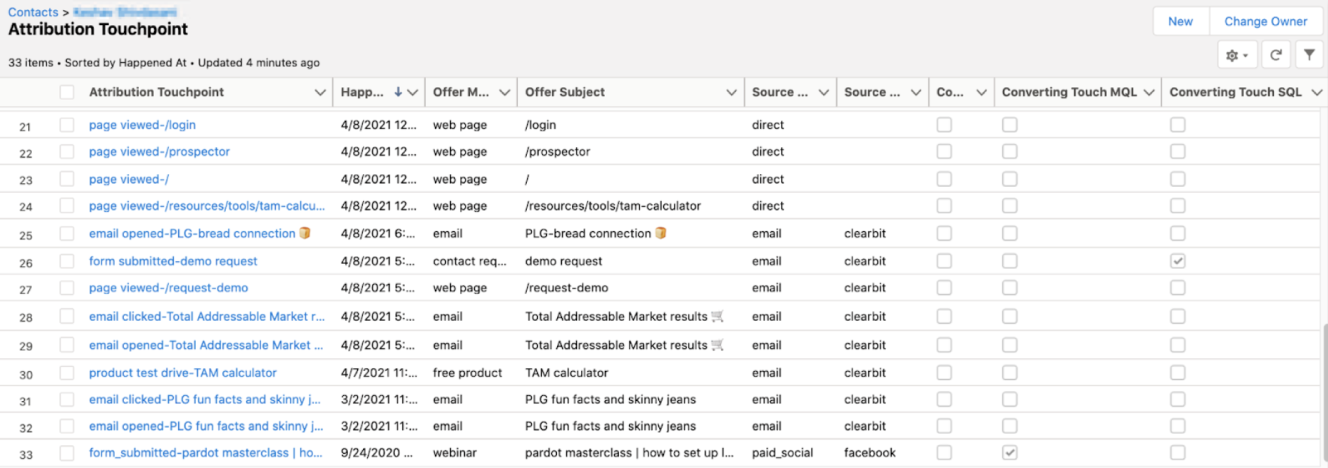
You may be thinking ok great, but show me the goods! What does that look like? We showed this output report in chapter 5 as well, but here’s a quick look at how we display our attribution model in Salesforce. At a glance, the team can see the offer medium, subject, and source, therefore better understanding conversion paths. Using this information helps the team optimize the buyer journey, choose the right marketing channels, and ultimately, drive more revenue.
Envoy
Envoy is the flexible workspace platform that helps companies manage safe hybrid workplaces. Much like Clearbit, they embarked on an attribution journey to provide their teams with the right insights and drive revenue forward. However, the path they chose looks a little different.
Envoy’s attribution strategy
Envoy started with a first- and last-touch model, with weight split evenly between the first and last touch. This worked for the team for a while, but with long sales cycles, they realized they wanted a better way to represent the interactions that occurred between the first and last touches.
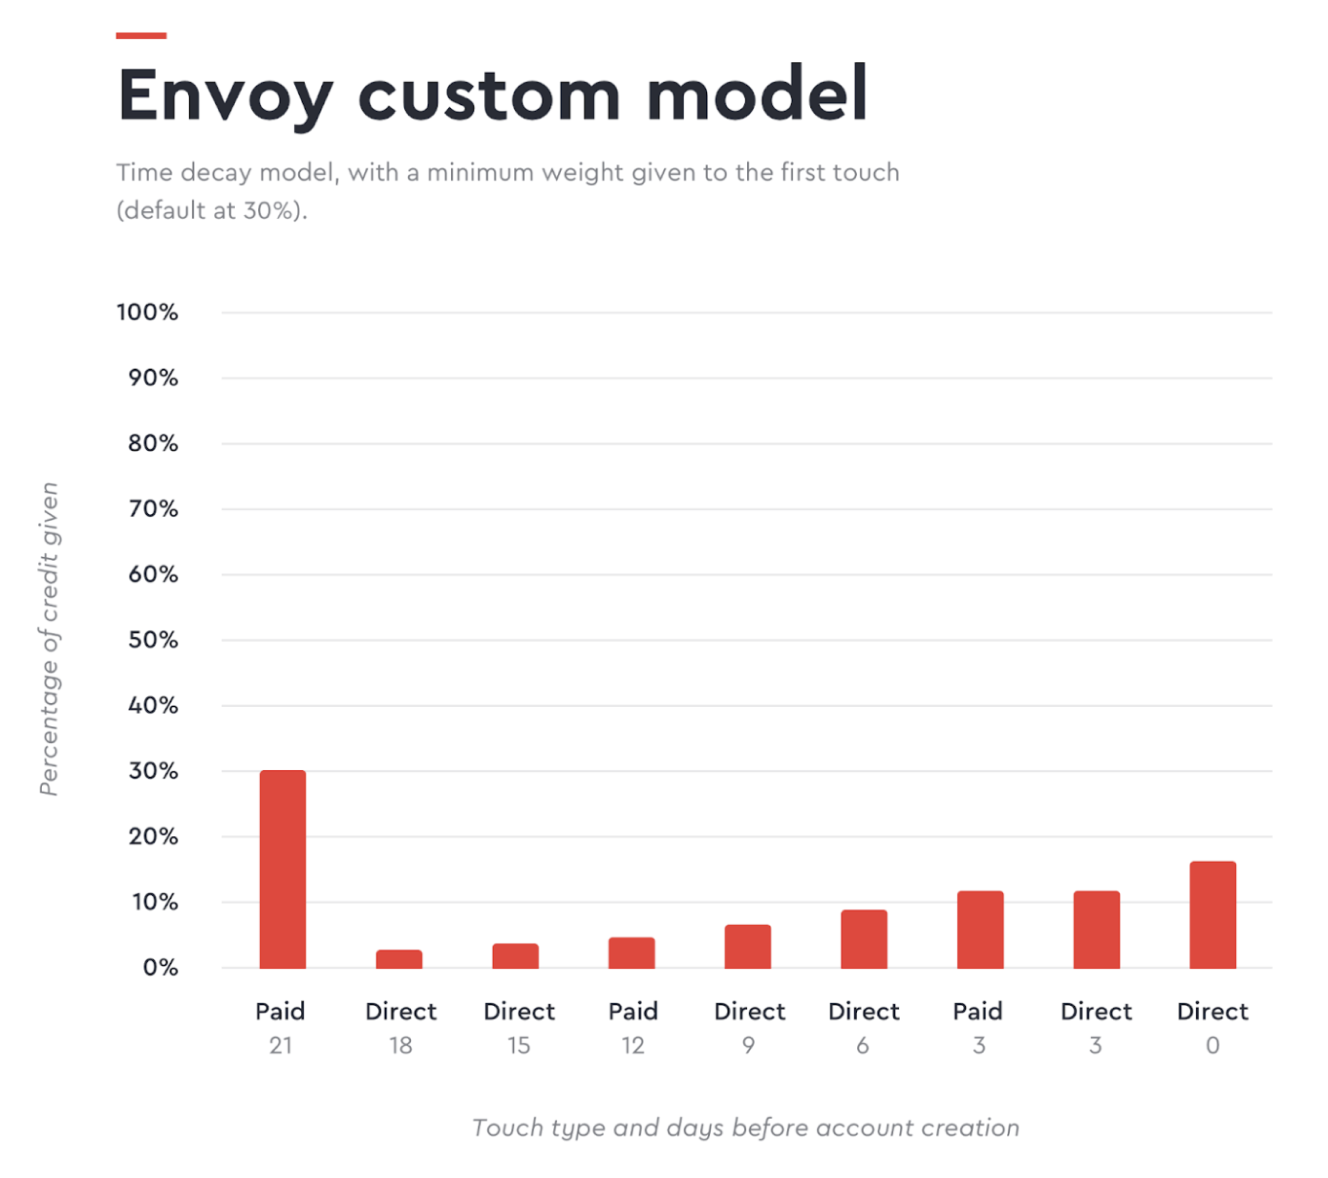
The Envoy team decided to shift to a time-decay-based model. For a quick refresher, a time decay-based attribution model places more weight on activities done closer to the point of conversion. Arvind Ramesh, Data Scientist at Envoy, shares that “touch weights are derived from an exponential time decay function, with a half-life of 14 days. This means that touches that happened 14 days before conversion are given half as much credit as touches that happened on the day of conversion. Touches that happened 28 days before conversion are given 25% as much weight as touches on the day of conversion, and so on.”
Though the team was happy with the time-decay model, Arvind still needed to make some changes. Generating top-of-funnel awareness was a big focus for the team so Arvind wanted to make sure the first touch received a minimum amount of credit of 30-40%. Arvind also adjusted the click-through window to ensure that if a direct click happened right after (within 48 hours) a paid ad click, the paid ad received more credit. Envoy is another example, that one size doesn’t fit all and you may need to think outside the box to find what works for your business.
Tech stack & output
Envoy has a robust tech stack to make this complex attribution strategy work. While there are many tools in their stack, here are some of the most critical solutions.
-
Heap: The team uses Heap to track events and visitor interactions like button clicks.
-
Redshift: Much like Clearbit, Envoy uses Redshift as their data warehouse. Heap data is fed through SQL to Redshift.
-
Stitch: Stitch is used to send certain data points like ad data to Redshift.
-
Mode: The team uses Mode to display all this attribution in a clean and digestible way to the end-user, marketers.
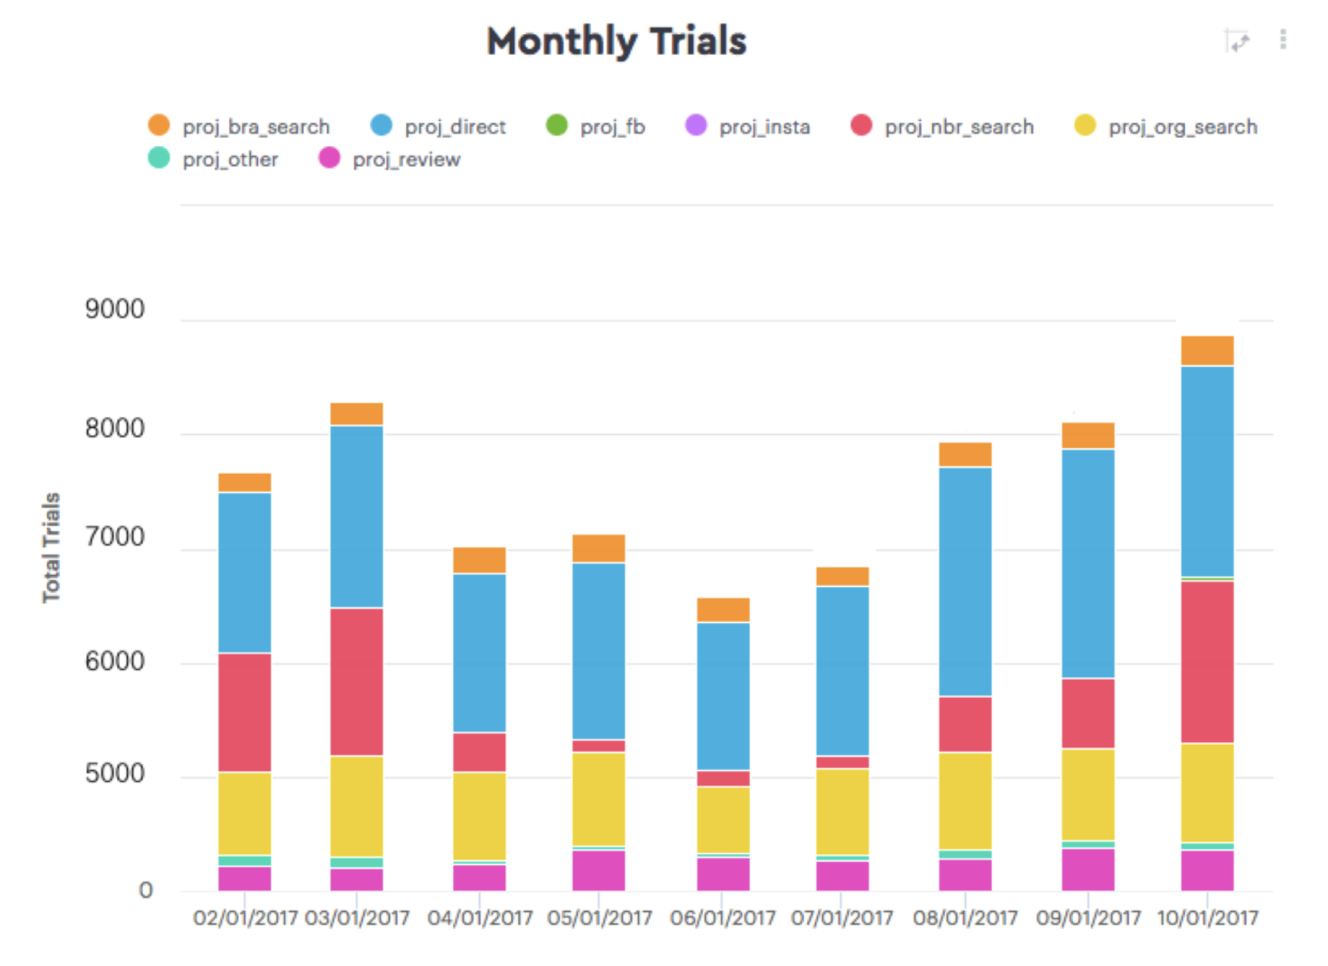
Here’s an example of how Envoy displays their monthly trial metrics by attribution source using the time-decay model. By using reports like this, the team can quickly and easily understand what sources are deriving the most trials, and where to focus their marketing strategy moving forward.
Hopefully exploring Clearbit and Envoy’s models reinforce that there are many different attribution models. We’ve said it throughout the book, but we’re saying it again, the purpose of attribution is to uncover insights that help you drive more revenue.
With that, we’ve reached the end of our book. Thanks for joining us as we dove into the world of attribution.
Before we part ways, here are some final words of wisdom as you embark on your attribution journey.
- There isn’t a one-size-fits-all approach.
- Don’t forget to maintain an open dialogue with cross-functional partners.
- Choose what works for your business and focus on insights over the perfect attribution model.
- Don’t forget to supplement quantitative insights with qualitative learnings.
- Julie Beynon and Craig Jordan know a lot about attribution – watch their webinar here!
