What is total addressable market (TAM)? 3 ways to calculate your TAM

If your team is exploring a new product or service line, you may be wondering whether or not exploring a new venture will be worth the risk.
Total addressable market, or TAM, is the term used to describe the revenue opportunity your product or service has within a set market. In other words, your TAM tells you how much money you could make if every company in your target market was a customer.
In this article, we’ll explore three ways to calculate your total addressable market, why this metric is so vital for go-to-market (GTM) strategies, and how your team can take advantage of the free tools and data to revamp your new product or service launch.

How to calculate total addressable market
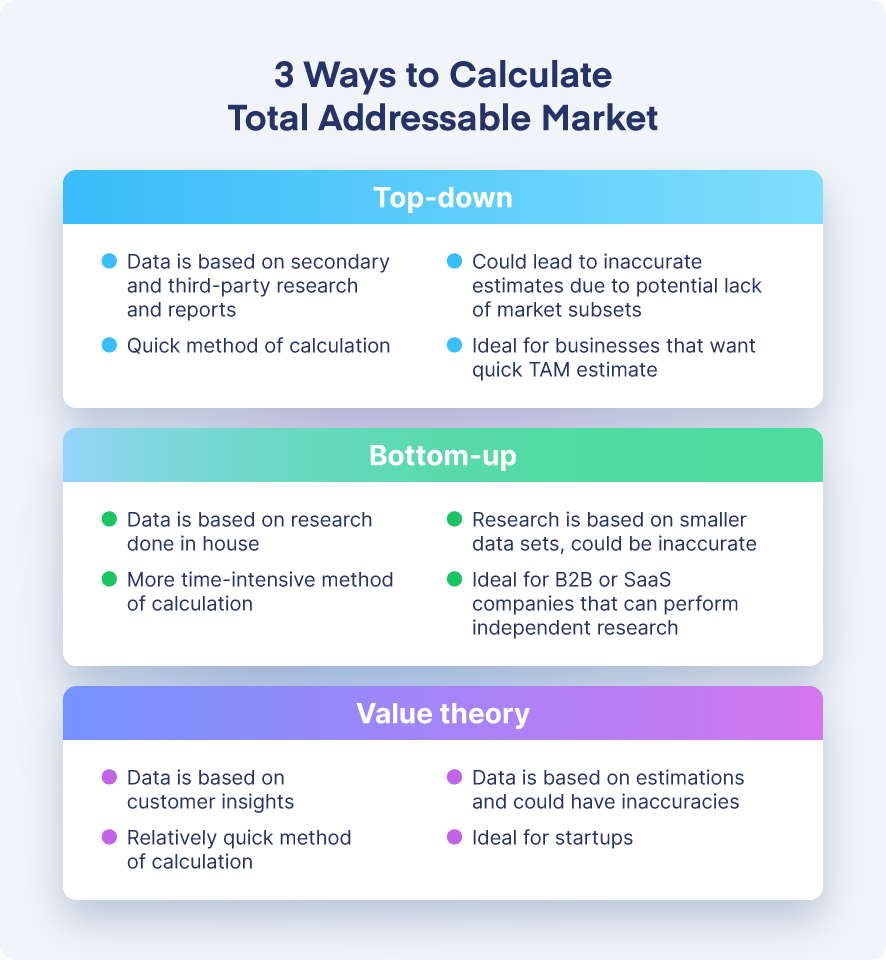
There are three methods of calculating the total addressable market:
- Total addressable market calculator
- Top-down
- Bottom-up
- Value theory
Each method focuses on different data points to create market and revenue estimates. They can provide nuanced insights and can also vary in accuracy.
Total addressable market calculator
If you want to determine your TAM but don’t want to maneuver through formulas to do it, we’ve got you covered.
Our total addressable market calculator is a free and easy way to get your TAM information without the equations. Simply input your annual contract value (ACV), and filter your results with eight company-related inputs such as industry, number of employees, business model, funding raised and more. From there, you will receive a comprehensive view of your TAM size, value, and companies that match your criteria.
Top-down method
The top-down approach for calculating your total addressable market is based on secondary industry research and reports. This includes third-party firmographic, technographic, economic, and demographic data gathered from reputable sources such as the CIA World Factbook, the U.S. Bureau of Labor Statistics, the International Trade Centre, UNdata, or Statista.
The data is then used to provide an estimate of the current state of your target market. This could include information about total expenditure, population, or characteristics of the group at large.
Once you’ve established your benchmark information, use your research to narrow the market into smaller segments based on the criteria set for your particular target market.
For example, let’s say your product is a line of cruise packages for seniors, and your target market—a senior living home—has 200 residents. Based on your product’s price point, you know that only residents with a monthly income of more than $5,000 will be able to attend, and your research of third-party financial reporting has informed you that only 100 residents, or fifty percent, meet the criteria.
# of total residents (total market) - residents who meet the criteria = TAM
200 residents - fifty percent of residents = TAM of 100 residents
Once you have your TAM, multiply it by the annual contract value (ACV)—or in this case, the price of the package, which is $2,500.
TAM x ACV = Estimated revenue
100 residents x $2,500 = $250,000 estimated revenue
Pros of using this method: Third-party data is easy to find online, making this a relatively quick method of calculation.
Cons of this method: Overarching data may or may not include information on market subsets. This could lead to inaccurate estimates that are drastically skewed.
Bottom-up
The bottom-up method is considered a more accurate method of calculating TAM and is based on firsthand data. This data is gathered from surveys or research conducted in-house, and is typically focused on current pricing and historic or known distribution and demand information.
To find your bottom-up TAM, start small and then extrapolate. In other words, start with the price value (or ACV) of your product or service and multiply by the known estimates from your firsthand research, such as the number of supply opportunities, your competitive market share percentage, or your estimated demand from customers.
For example, imagine you’re offering landscaping services for $150 a day to a community of 100 homes. Based on your work from the last month, you know that 60 of those homes will be interested in your service.
Data estimate x annual contract value (ACV) = TAM
100 homes x $150 = $15,000 estimated revenue
Product value x data estimate = TAM
$150 a day x 60 homes = $9,000 estimated revenue
Pros of using this method: Firsthand data is proven, provides more accuracy, and focuses on relevant markets. This approach is ideal for B2B, SaaS, or mid-to-enterprise-level companies that have access to data resources.
Cons of using this method: Conducting research can be time and resource intensive. This research is also often focused on smaller data sets, which can skew estimates, and typically does not take unknown variables into account, which can upend estimates without warning.
Value theory analysis
The third method for finding your TAM is value theory, an analysis that uses customer insights to inform data values. This method focuses on the value a service or product will offer a customer and what they are willing to pay for it. If a product or service provides value that a customer has not gotten before or cannot get from a competitor, the value will be reflected in the price.
This price is then multiplied by the estimated market size for your product. Market size is based on the shared agreement of a product value add and preference over the competition.
For example, let’s say you launch an app that digitizes and houses all of a student’s textbooks in one place. You polled students at a local university and found that 250 claimed an app like that would be useful and that they would be willing to pay up to $150 a semester to use it.
(Estimated ACV) x (estimated market size) = TAM
$150 per semester x 250 students = $37,500 estimated revenue
Pros of using this method: Estimated values do not rely on extensive research that drains resources. Its focus on new values makes it ideal for startups or SaaS companies offering new products or services.
Cons of using this method: All data is based on estimations, which may inherently be inaccurate.
Challenges associated with calculating your TAM
Despite the variety of ways to calculate your TAM, the process of finding that figure can be resource-draining and complex.
Hiring a research firm or contracting an analyst for support can be expensive, often costing anywhere from $20,000 to $50,000 for custom market research. This process can also take months to complete, which could in turn affect your time to market.
On the other hand, those who opt to handle the research in-house by relying on a simple Google search to save on costs may not have access to the granular data necessary to define an accurate TAM. For example, searching on Google or even LinkedIn can give information about a company’s size, but not what technologies a company uses, which may be an important factor to consider in your overall TAM calculation.
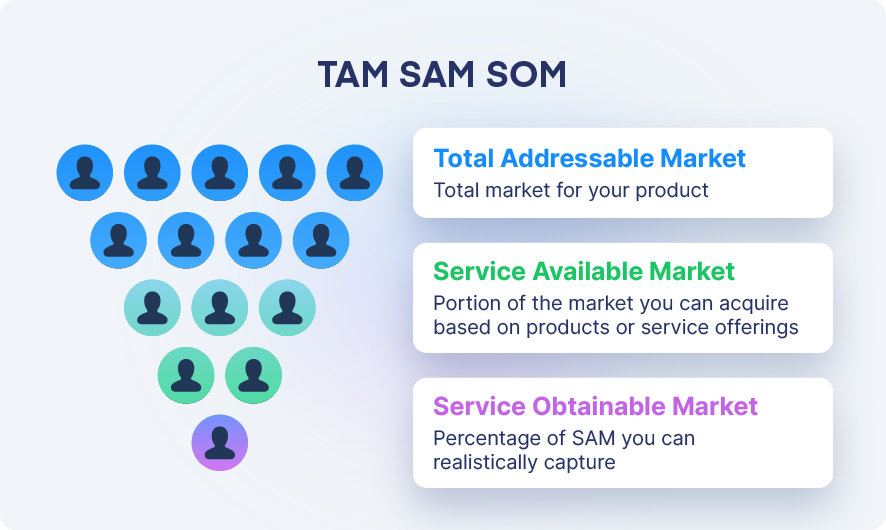
The differences between TAM vs. SAM vs. SOM
While your target addressable market identifies all companies that fit your criteria, your serviceable available market (SAM) and serviceable obtainable market (SOM) help further narrow the universe.
Total addressable market (TAM)
TAM is the first step in understanding your available market. This metric gives you a base estimation of what your market could be.
Serviceable available market (SAM)
Your SAM identifies which companies you will actually be able to acquire based on your business model, products, or services. This segmentation narrows your large market pool into submarkets, which allows you to target more qualified customers or alter your approach toward different market groups.
Serviceable obtainable market (SOM)
SOM goes one layer deeper by looking at which companies would realistically buy your product or service and comparing your market share against your competitors. The resulting metric gives the most refined view of your market and is valuable when setting short-term growth targets.
Identifying these subsets within an industry requires some market research to understand the proportions of each area. A holistic go-to-market strategy considers all three layers.
Why understanding your TAM is so important
Why is understanding your TAM so important? Whether you’re just getting started as a company or you’re considering going after a new segment, identifying your TAM should always be the first step when building a go-to-market strategy.
Understanding your TAM can:
- Support product, customer segment, and business opportunities to prioritize and back with resources
- Act as a business value prop that displays your market potential to investors
- Establish a main goal for all teams to aim for
- Provide insight into your company’s share and competitive edge within a market
- Assist in budgeting and resource planning
- Enhance your entire team’s ability to understand and navigate your target market
- Support decision making with insights on revenue and expenditure impacts
- Give insight on whether a new venture will be worth the risk
As insightful as this metric is, it’s important to remember that every TAM is subjective. That means that there is no such thing as a “good” total addressable market size. Remember to use this figure as just one tool combined with your entire GTM strategy in order to make the most informed choices.
What’s next?
With your total addressable market in place, you’re off to the races.
Remember, your TAM isn’t static. Your company and the companies around you are constantly changing, so it’s important to revisit your TAM over time—especially when entering new markets or segments.
It’s also important to keep your TAM from falling off the radar. Using it to inform your ideal customer profile (ICP) will make it easier to target value-generating customers. With a clearly defined ICP, you can activate across channels and platforms to drive more conversions and, ultimately, revenue.