The search for a healthier ideal customer profile

Chapter 7
11 minutes
The search for a healthier ideal customer profile
A few years ago, some of the more experienced folks on Clearbit's Customer Success team expressed skepticism about whether a few of our newly-won customers would be successful with Clearbit.
We asked these teammates why, and they told us that, in their experience, the customers who seemed to get the most value from our products had high website traffic and high lead volume.
Their observations led to a hypothesis: Clearbit customers with the highest renewal rates also have high website traffic.
We checked it out by analyzing the LTV of all our customers, both current and churned, comparing low-traffic companies with high-traffic ones. At the time we used Alexa Rank as a proxy for site traffic, but we would now recommend using Clearbit Traffic Rank, a Clearbit Enrichment attribute that helps you understand how a company’s website traffic stacks up against other businesses online.
We found that, generally speaking, our hypothesis was true. The high-traffic customers had a 20%–30% higher LTV than low-traffic customers. We were onto something. Next, what about our leads? Did high-traffic leads reliably show potential for high LTV?
I want to try. When is the best time for a company to do an LTV ICP analysis?
If your SaaS company wants to do the same analysis, a good timing benchmark might be to have ~$10M ARR and two to three years of renewal data. But don't let a lack of data stop you from taking a deeper look into the true value of your products for customers.
Expected lifetime value per lead: One comparison metric to rule them all
To find the potential LTV for high-traffic leads, we compared cohorts of companies that contained prospects and customers.
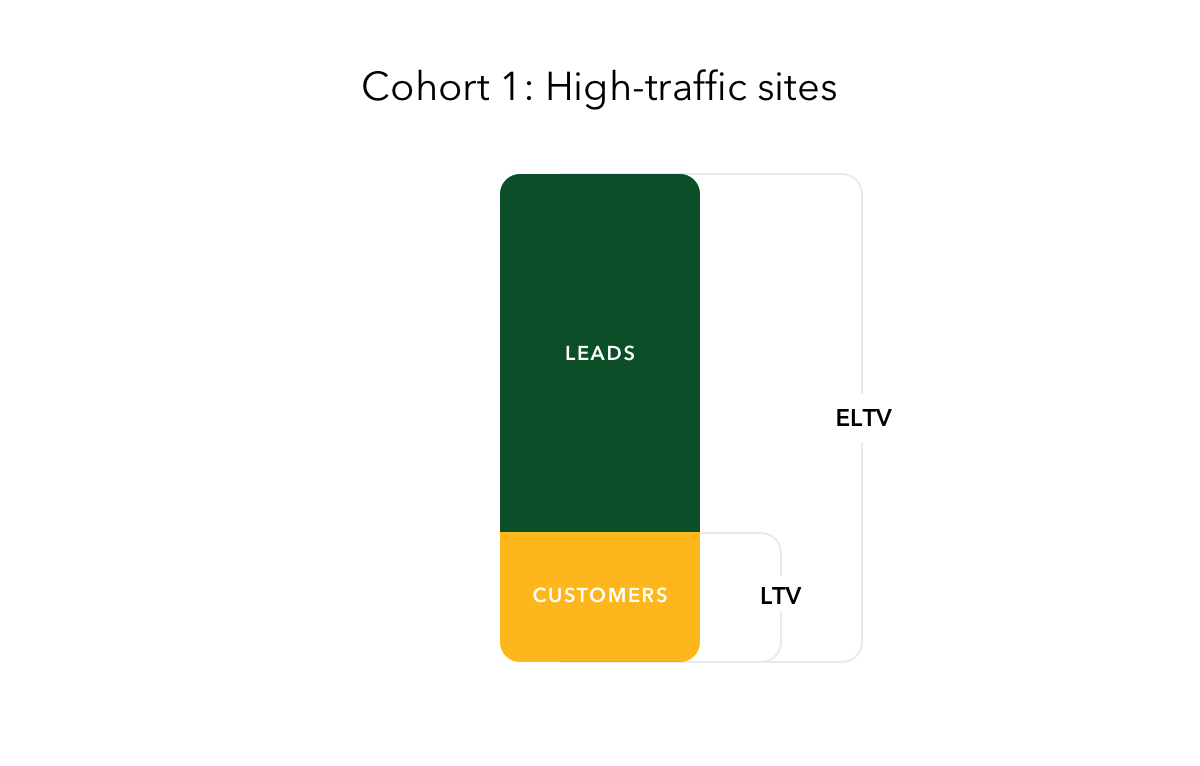
The comparison metric that enabled us to compare the future value of a cohort of leads is expected lifetime value (ELTV) and its derivative, expected lifetime value per lead (ELTVL).
To calculate ELTV, we took LTV data from the customers in a cohort and pulled it back to the "beginning," so the group included all the leads that started out in the same cohort. (In other words, ELTV is the lifetime revenue we can expect to generate from a certain cohort—some of them will become customers, some won't.)
Then, to determine a cohort's ELTVL, we divided ELTV by the total number of leads in the group. ELTVL let us assign an expected value to each individual new lead in our funnel, based on its firmographic characteristics and the cohort it fit into.
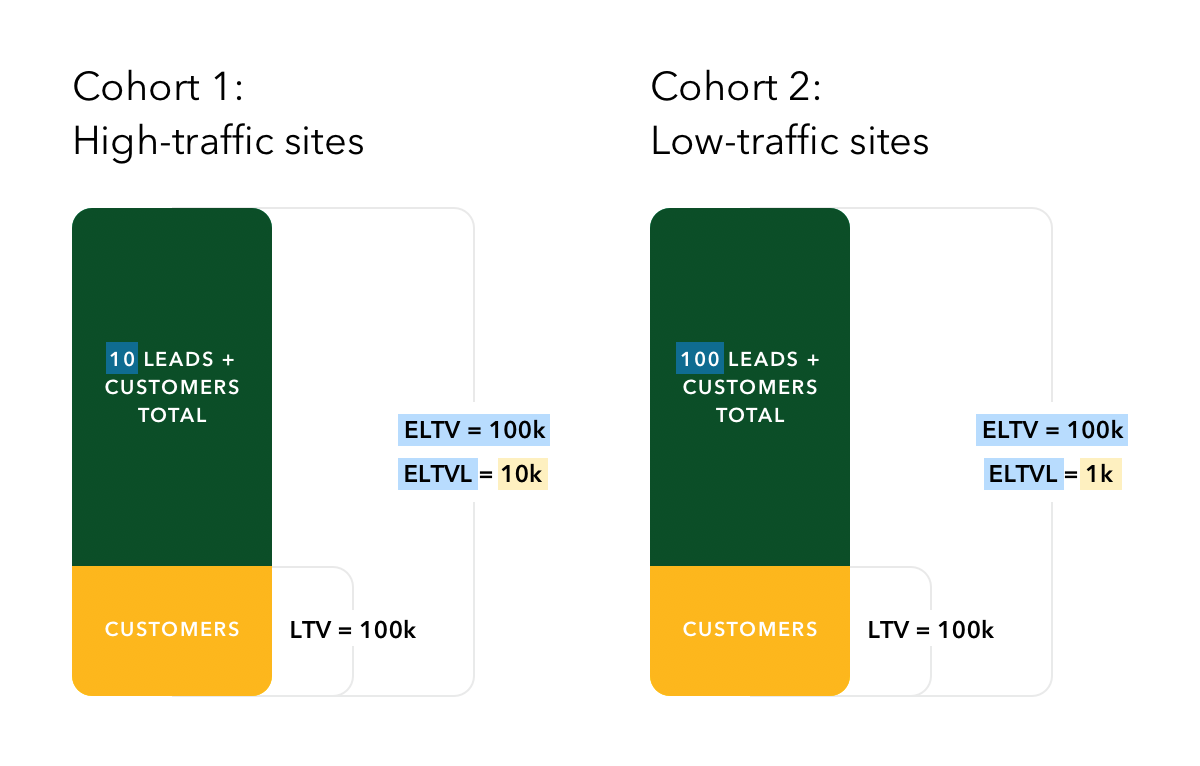
Let's illustrate with an example. If there are 100 leads in a cohort, and we sell one at $100,000, then the ELTV of the cohort is $100,000 and the ELTVL is $1000 (dividing $100,000 by 100 leads).
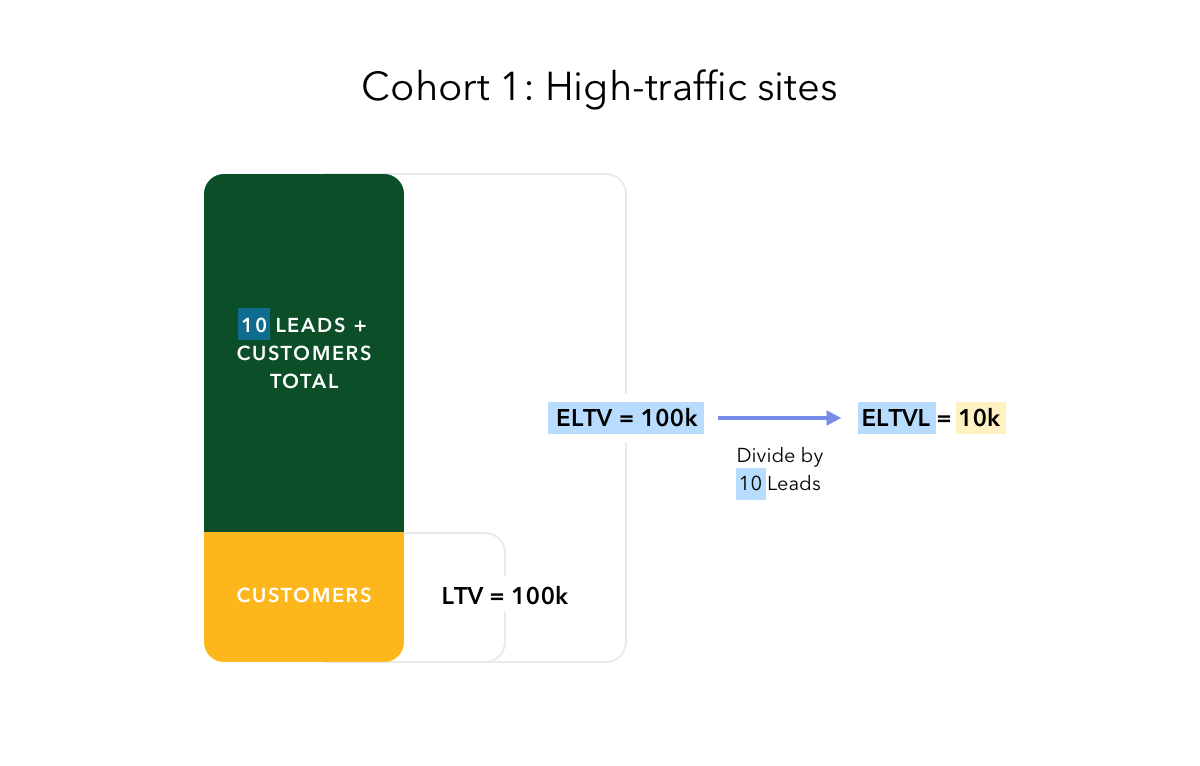
But if we make the group a bit more "selective" with only 10 leads, and it produces $100,000 of LTV, then the ELTVL is $10,000. The leads in this smaller cohort are much more valuable than the leads in the larger cohort.
We like ELTVL because it gives us one metric to use when comparing groups, rather than using many in-between conversion points, such as "lead to MQL," "MQL to SQL," "SQL to SAL," "one renewal," "two renewals," and so on. It abstracts the calculation to give new leads a single dollar value.
It lets us generate different segments, defined by firmographic characteristics, and compare their ELTVL. We can move around the firmographic boundaries until we see a cohort that produces a high lifetime value.
Going back to our hypothesis that high website traffic predicts high retention and expansion, we used Alexa Rank to parcel out some cohorts and calculate their ELTVL.
Hypothesis testing with ELTVL and our new LTV ICP
We wanted to segment our entire lead and customer base by varying website traffic. But how many segments should we create? And at what website traffic thresholds should we draw the boundaries?
In creating cohorts, our goals were to find:
- the smallest-sized group producing the maximum ELTV
- a large ELTVL disparity among segments (for example, we'd prefer to find segments with ELTVLs of $100 versus $5000, rather than find a smooth gradient of $100, $200, $300, $400; the high-contrast segments would help us make the most revenue impact with lean resources)
- as few groups as possible, but as many as necessary
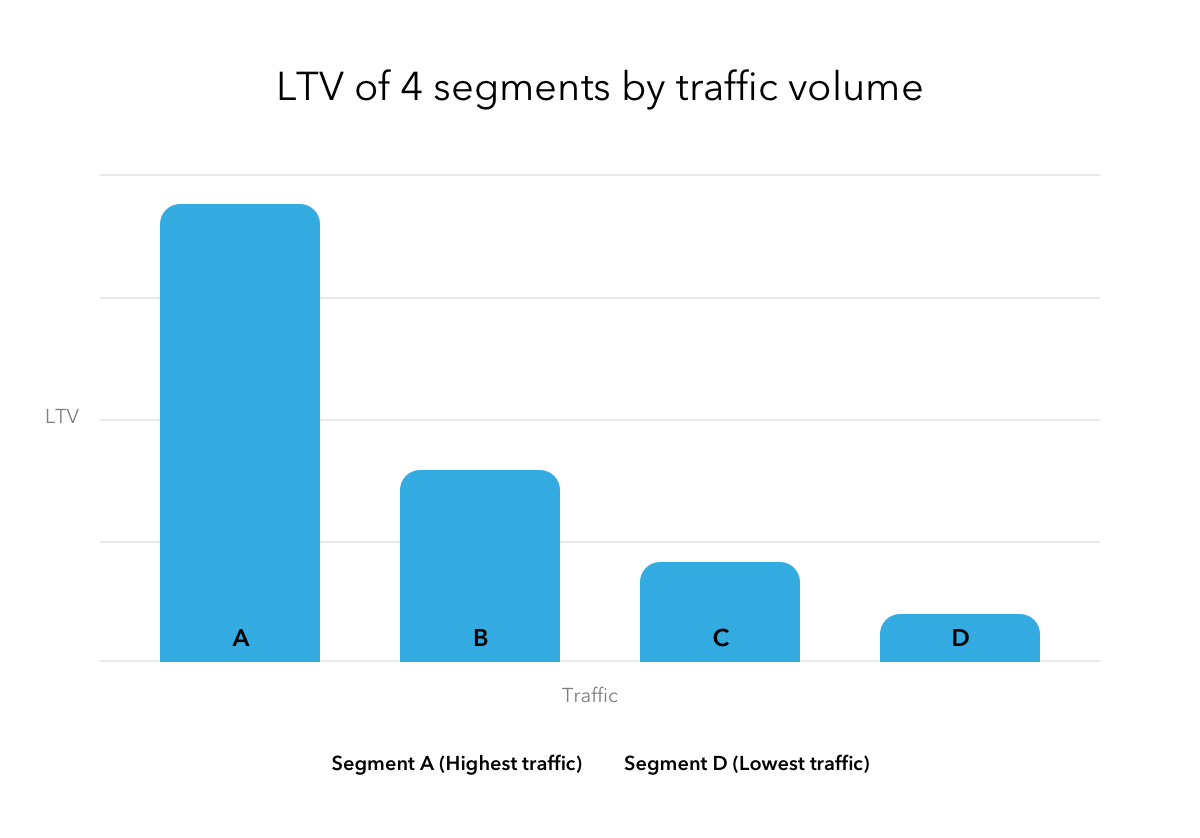
We started by dividing our universe into four equal segments defined by Alexa Rank and calculated their ELTVL. We tinkered with the Alexa Rank lines until the ELTVLs of the segments looked sufficiently different.
We found four segments that had rather large ELTVL disparities, helping us focus our attention on the groups of companies with the highest long-term revenue potential.
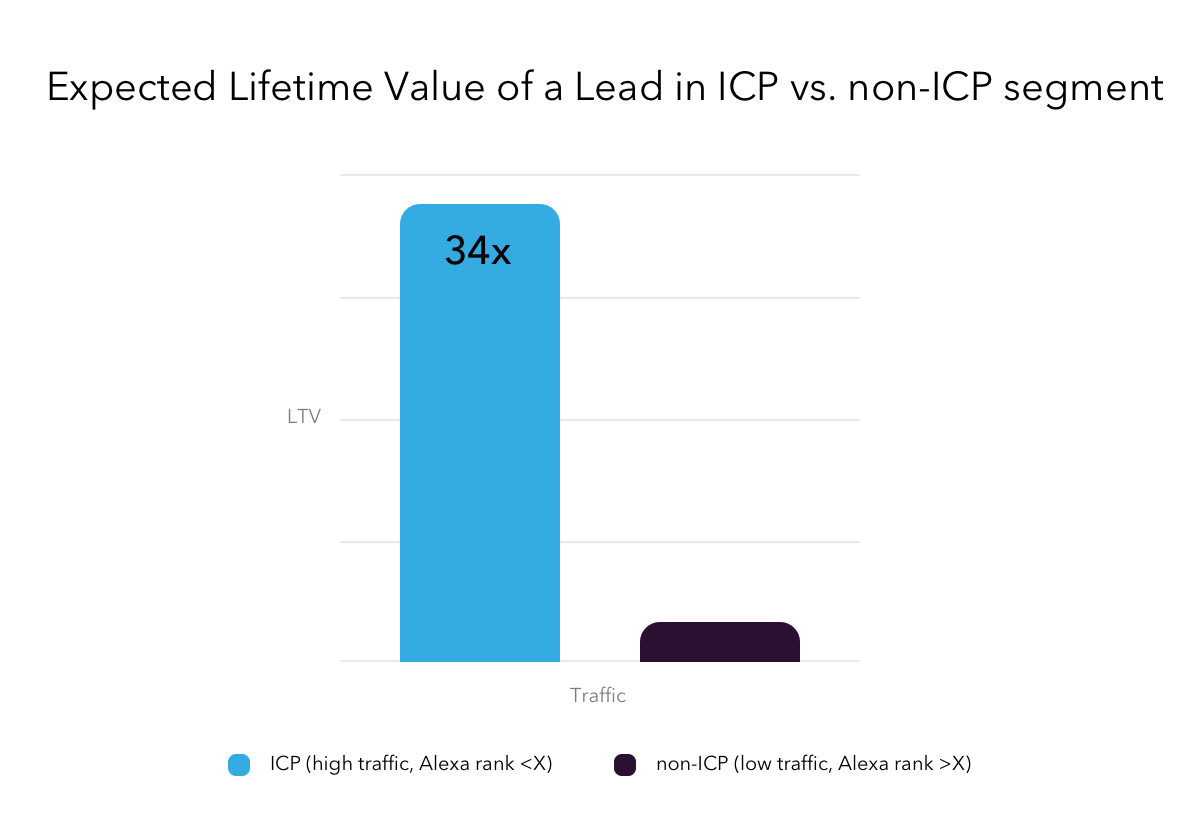
Next, we simplified it to just two groups. We could combine A and B, then C and D, creating two cohorts separated by a single line.
One Alexa rank number divided our universe into sufficiently different groups, where everything on the high-traffic side had an extremely high ELTVL. In fact, a lead in this cohort had an ELTVL 34 times higher than leads in the low-site-traffic side.
We'd had a hunch that website traffic mattered, but we had never investigated it deeply in the context of LTV. And we'd never seen it backed up so broadly and powerfully until now.
We did a light covariance analysis, testing the effect of other firmographic attributes on ELTVL, such as number of employees, B2B companies vs B2C companies, revenue, marketing team size, and industry. Some of these variables created a nice segmentation, and number of employees in particular was a strong predictor of ELTV. But when we normalized for website traffic, it barely made a difference. Traffic was by far the strongest predictor.
Understanding where our product fits into a customer's world
Why does website traffic predict a company's success with Clearbit?
Simply, because it's a proxy for lead volume. The more site visitors a company has, the more form fills they get and the bigger their database of leads. Marketers and salespeople use Clearbit data to understand, segment, and prioritize these leads, and the more they need to work with, the more valuable Clearbit data becomes. These companies deal with a lot of noise, and Clearbit helps them find their signal.
So, we had our new ICP: any company with higher website traffic than a certain global Alexa rank number. This neatly divided Clearbit's addressable universe into two.
Next we analyzed our funnel, to see the past performance of ICP and non-ICP leads.
Funnel analysis: The Pareto principle in action
In our funnel analysis, we wanted to see how customers in our high-traffic ICP group were performing, and discover how many ICP leads were currently traveling through our funnel (or bow tie, as it were).
The funnel stats we looked at included:
- # of Leads
- # of MQLs (marketing-qualified leads)
- # SQLs (sales-qualified leads)
- # SAOs (sales-accepted opportunities)
- # Won (customers)
- $ Bookings (revenue at the time of booking)
- $ LTV (lifetime revenue)
We found that 18% of our total leads were ICPs (the leftmost column in the chart below, where the light-colored lower bar represents ICP leads). We also found that ICP customers were responsible for over 86% of our long-term revenue (the rightmost column in the chart).
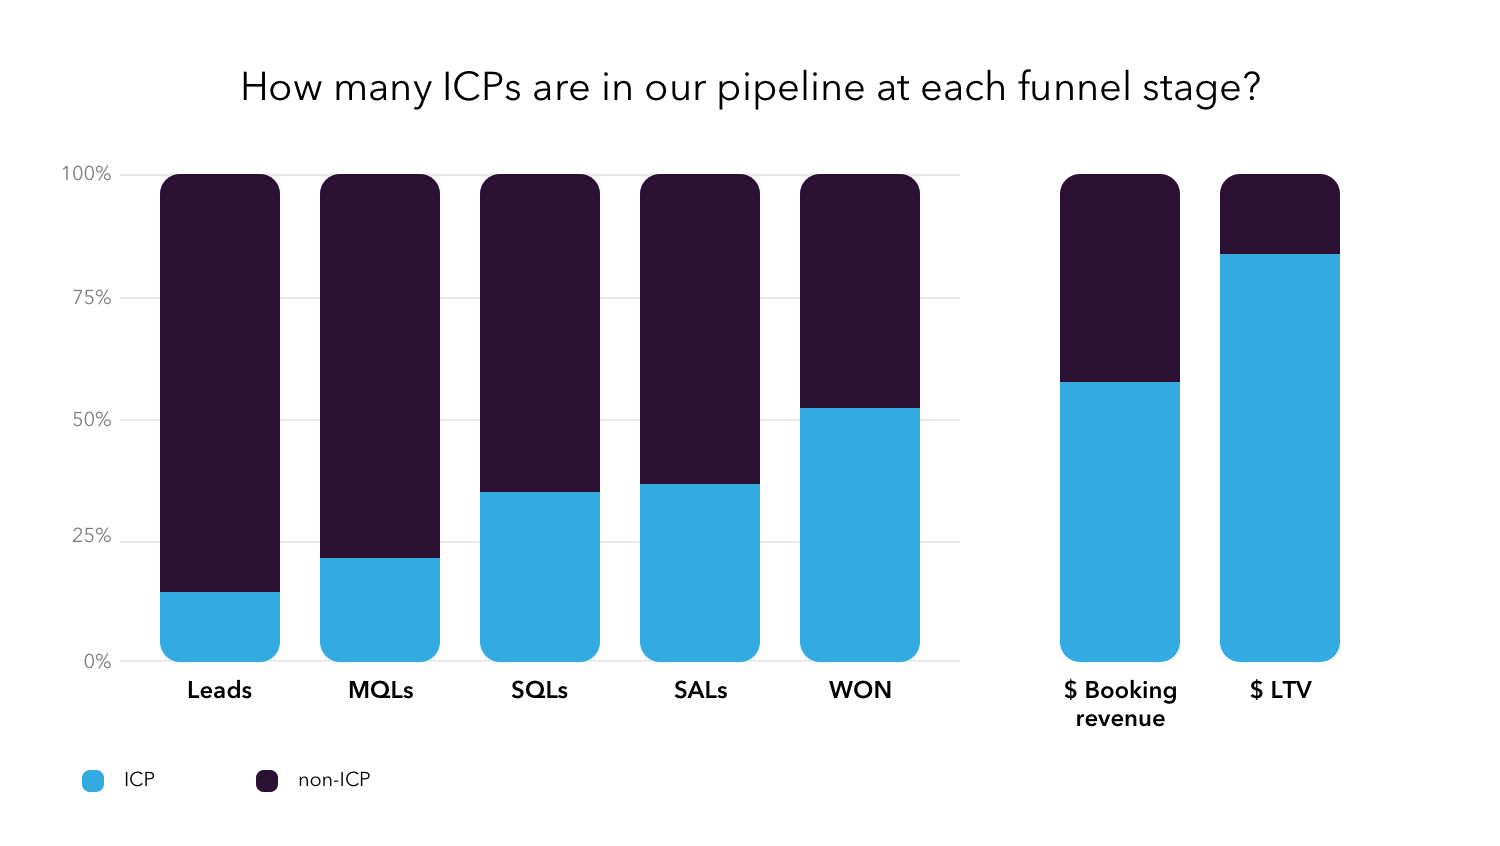
ICP leads drove a little over 50% of bookings; that is, they made up half of our Won customers and half of our Bookings (booking revenue). But they renewed and expanded more, and ended up pulling in 86% of Clearbit's long-term revenue over the years.
These leads were also easier to sell and convert at every stage of the funnel. In the chart above, the bar representing ICP prospects increases in size at every conversion step and comparing the Won customers bar with the Bookings bar shows that ICPs had slightly higher average contract value.
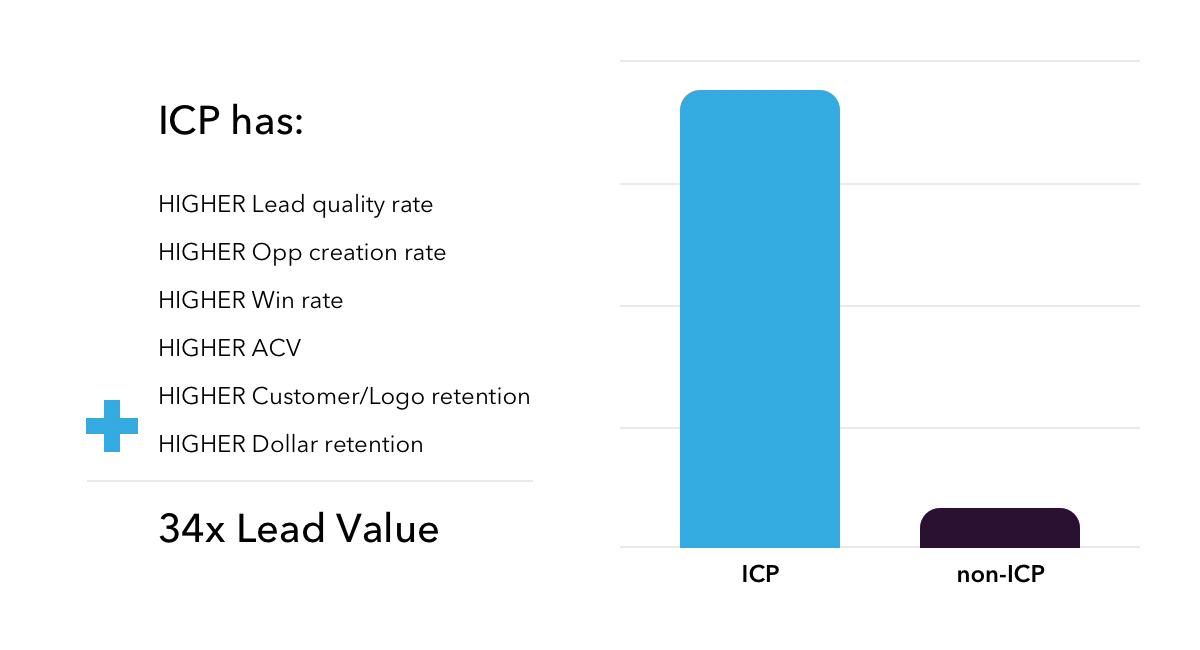
These customers were more efficient by many metrics, including lead quality rate, opportunity creation rate, win rate, ACV, logo retention, and dollar retention.
This funnel analysis increased our confidence in our ICP — we had found a small group of leads (18% of total) that would let us focus our resources for the highest revenue impact over time.
Two segments: A simple guide for the whole company during a strategic shift
Time for a quick reality check. Does it really make sense to have only two customer segments, based on one variable? Just one line drawn in the sand? What about tiered lead scoring and customer personas? The real world is nuanced.
And that's true. So we're treating our Alexa Rank ICP as a starting point to refine and iterate upon. We continually add to our understanding of who our ideal customer really is, including the stakeholders in this more specific set of companies. We also continue to optimize the number where the Alexa Rank line should be drawn, to match our business health and economic climate. In addition, we have multiple personas within our ICP that represent the individual end-users and buyers, and we personalize our messaging for different segments within our ICP, such as industry.
But with that said, a two-segment model has indeed been useful during this big strategic shift, because there is a lot of value in simplicity.
It's easy for everyone at Clearbit to rally around the concept that website traffic correlates with long-term customer success. We benefit from having a simple, directionally-correct answer when we ask, "Who are our healthiest customers?"
It's extremely helpful to know that one segment is 34 times more valuable than the other, even if it turns out we drew the line a little "off" and that segment is only, say, 25 times more valuable. And our work would be much more complicated if our ICP model had five equally important metrics, all interacting with one another.
Today, we're confident that every lead going to an SDR, AE, or CSM is more valuable than before.
How teams are changing to serve our LTV ICP
Of course, our new ICP model threw our old marketing and sales playbook out the window. We experienced plenty of fear, uncertainty, and doubt. Our sales team, for example, had to deal with their addressable group of leads being slashed. Imagine how you'd feel if suddenly you could speak only to a third of the leads you were used to having.
It was a tough culture change and it didn't positively affect paychecks right away. We needed everyone on the team to understand why a narrow focus was right for the business and how it would keep our company healthier in the long run. Meanwhile, other decisions began to get easier. Shifts across Clearbit included:
- Product: Making changes to Clearbit's product roadmap and thinking more carefully about features and functionality that affected high-site-traffic customers.
- Engineering: Making sure the product scaled for high-volume customers.
- CS: Finding new ways to provide white-glove support for our ICP customers and helping them solve their pain points.
- Marketing: Focusing all new demand activities exclusively on ICP accounts. Think ABM, but for 30,000+ accounts.
- Sales: Creating incentive structures within contracts to improve customer success over the long term and offset the risk of churn. In addition, SDRs were speaking with potential customers who weren't a great fit for Clearbit, helping them understand why that was so through the buying process. That wasn't something your average SDR did.
Leadership played an important role in reinforcing the benefits of Clearbit's new, narrowed focus. Again, the fact that it was such a simple binary — difficult to misinterpret and bend the rules — made it easier to repeat over and over.
Naturally, this opened up a whole new set of questions. And if we narrowed the top of our funnel, would we be willing to take a short-term hit to top-line revenue growth in exchange for long-term profitability?
Growth-stage startups constantly grapple with this tension, especially when top-line growth is so incentivized by VCs and the SaaS industry at large. They may choose to avoid strategies that threaten top-line growth, even if they know it'll make the company healthier in the long run.
We need to remember that this definition of growth is not the only thing that matters. For us, our focus on healthy customers and healthy revenue helped us find the phenomenally efficient company within.