Find your key activation event to prompt onboarding

This is the first post in a two-part series: How to Take Lead Enrichment Beyond the Funnel.
You can't push a magical button to increase customer retention. But with some effort, you can find your product's magical moment.
The key activation event (KAE) is the key that unlocks the path for people to become loyal customers. It enables them to see the light (aha!), and start appreciating your product for what it can do for them.
For instance:
- For Mailchimp, it might be the moment a user hit “send” on their first campaign.
- For Expensify, it could be when they photograph their first receipt and watch their reimbursement land straight in their bank account.
- For Airbnb, it could be the point when they bookmark a search result for a cozy cabin as a favorite.
When you know your KAE, you can design your onboarding flow around it and meet larger strategic goals like increasing customer LTV or boosting retention.
The first step is identifying that magic. How do you know what your customers' KAE is? Let's find out, by going through how to:
- Identify your user goals
- Map out your onboarding process
- Determine your key events
- Calculate your key activation event.
How to Calculate Your Key Activation Event
To find your KAE, you don't need a slew of data scientists. Instead, examine each of the events in your user onboarding and see what has the best chance of driving meaningful activation.
1. Define your goal.
First, take a step back and define your objective. Likely this goal will be around key business metrics like conversion or retention. Maybe it's to reduce churn, increase customer lifetime value, boost conversions to paid, get more handraises to sales, or increase referrals by a certain amount.
To illustrate, imagine you have a photo-sharing product where users can create digital photo albums to share with friends and coworkers. One of your objectives for the quarter is to improve long-term customer loyalty and figuring out your KAE will help you make progress towards that goal.
But we need to define what "long-term loyalty" means. Let's say it means using the photo-sharing platform for a 12-month period, without any break longer than 30 days. That gives you a specific enough goal to work towards, where you can answer "yes" or "no" to whether you've been successful.
2. Map out your onboarding process.
Review your current user onboarding process:
- What are the potential paths a user may take?
- What guiderails have you built to impact those paths?
- What steps do you think help the user get set up for success?
- What helps give them a reason to come back?
Let's go through a potential onboarding journey for our pretend photo-sharing platform example:
- Signing up for an account involves filling out a profile.
- In the last step of sign-up, the user gets the option to invite friends to the platform, as well as to follow other accounts by adding contacts or following suggested users.
- After sign-up, the user lands on a video demo introducing the platform's main features.
- The final step of the demo is to encourage the user to create their first photo album for their portfolio.
3. Define your events.
The next step is to turn your onboarding sequence into clear, discrete events.
We could extract these events from the four steps outlined above:
- User fully completes profile details (they fill out their name, add a profile picture, write their bio, and create custom slug).
- User follows at least three other users on your platform.
- User invites at least one people to join the platform by:
- importing a contact
- inviting a contact after integrating their social media account
- inviting a contact by email.
- User watches the entire demo video.
- User creates their first photo album on their platform and adds at least one photo.
Notice that each event in this list is specific enough that it can be answered with a simple "yes" or "no" to whether it happened. For example, "adding friends" doesn't work as an event, but making it measurable by adding a specific quantity does.
4. Calculate the associations between your events and your goal
Next, let's assess the impact of each event on the goal defined in step one. We'll be using a statistical measure called the phi coefficient (which we learned about from a great post by Madkudu's CRO Francis Brero as well as Mixpanel's opportunity score feature). The phi coefficient calculates the strength of association between an event and an outcome, like how watching a demo video correlates with long-term loyalty.
Choose one of the events that you defined in Step 3. Get a count for how many users who did perform that event did or didn't convert to your goal. Then count up how many users who didn't perform that event did or didn't convert. A table with those results would look something like this:
| Retained user | |||
|---|---|---|---|
| Yes | No | ||
| Watched an in-app demo | Yes | 110 (A) | 24 (B) |
| No | 312 (C) | 15 (D) | |
Use the table as a guide to calculate your phi coefficient with the formula below. We've put the formula variable corresponding to each value in parentheses next to it (e.g., the Yes x Yes number is "A").
$$\phi \equiv \frac{AD-BC}{\sqrt{(A+B)(C+D)(A+C)(B+D)}}$$
When you plug the numbers in from your table, you get:
$$\phi \equiv \frac{-5838}{26854.36}$$
Which becomes this:
$$\phi \equiv -0.22$$
The result is your r-value. The closer the result is to 1, the stronger the association. The close the result is to -1, the weaker.
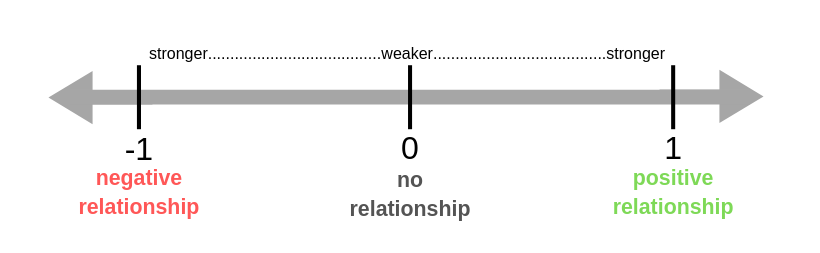
Here's a rough breakdown.
- exactly +1.0: a perfect positive relationship
- between 0.21 and 1.0: positive relationship
- 0: no relationship.
- between -0.20 and +0.20: weak to negligible relationship
- between -0.21 to -0.70: negative relationship
- exactly -1: perfect negative relationship
A perfectly positive relationship sounds ideal, but it's not really helpful for our KAE exercise. Basically that's a 100% conversion rate, which often means the event/action is a required step for the goal (such as inputting a credit card to make a purchase.)
So, a result of -0.22 shows a low negative association between someone watching your current demo video and whether they stick around for a year.
Repeat this process for each event.
5. Compare each of your lead onboarding-journey events to identify the key activation event.
Now, to determine your KAE, we'll look at how all the events and their association with our retention goal stack up against each other.
Look for the event with an r-value closest to +1.0, which means it has the strongest association with conversion to your goal. Ensure that your key activation event's phi coefficient is at least +0.40 (beyond just a low to moderate positive association). If the phi coefficient for all events falls below +0.40, then you do not have any event that is strongly associated with conversion.
Let's say you calculate the phi coefficient for each of the events laid out above, and this is what you find:
| Event | r-value | Interpretation |
|---|---|---|
| User completes profile details (they fill out their name, add a profile picture, write their bio, and create custom slug). | 0.3 | Positive relationship |
| User follows at least three other users on your platform. | 0.35 | Positive relationship |
| User imports at least one contact. | 0.23 | Weak positive relationship |
| User integrates their social media account and invites at least one contact. | 0.8 | Strong positive relationship |
| User invites at least one friend to join the platform by email. | 0.2 | Weak positive relationship |
| User watches the entire demo video. | -0.22 | Negative relationship |
| User creates their first photo album on their platform and adds at least one photo. | 0.6 | Strong positive relationship |
Then we can quickly rank each event by r-value to identify which most strongly associates with becoming a long-term user.
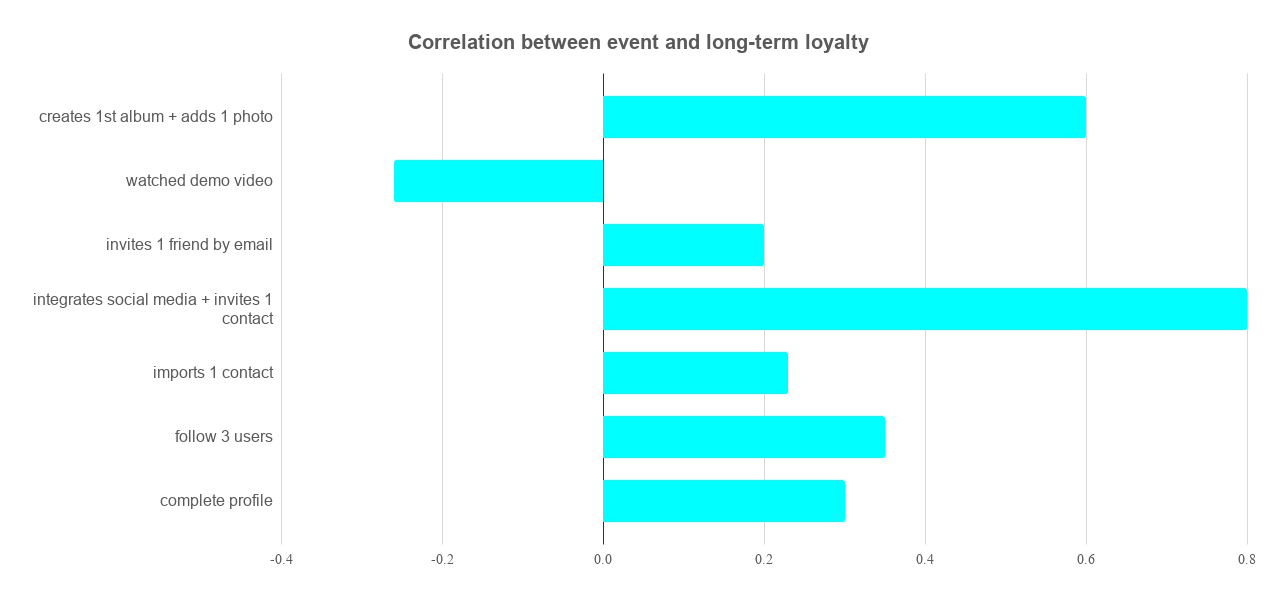
In this case, your key activation event is when a new user integrates their social media account and invites at least one other person to join your platform to see their portfolio.
The next step: update your onboarding journey
Once you know your critical events for conversion, you can start to strategically build out a stickier, and perhaps more personalized, lead onboarding experience. In our example, you'd want to make social media integration a key part of the onboarding experience to drive engagement and retention.
As a performance metric, activation shows you how well you bridge the gap between a new sign-up and a happy, retained user. Improvements to activation can cause a greater-than-proportional increase in revenue. So pave the way for users to experience real value and convert more of them into loyal users.